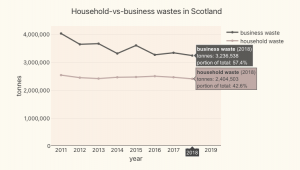
This graph provides an at-a-glance-comparison between Scotland’s households and businesses in respect of the yearly amounts waste that they have generated during the last decade.
The household:business ratio has been very approximately 2:3, but waste from businesses has been reducing noticeably over the decade.
