A simple alternative search over Open Data Scotland’s dataset indexes

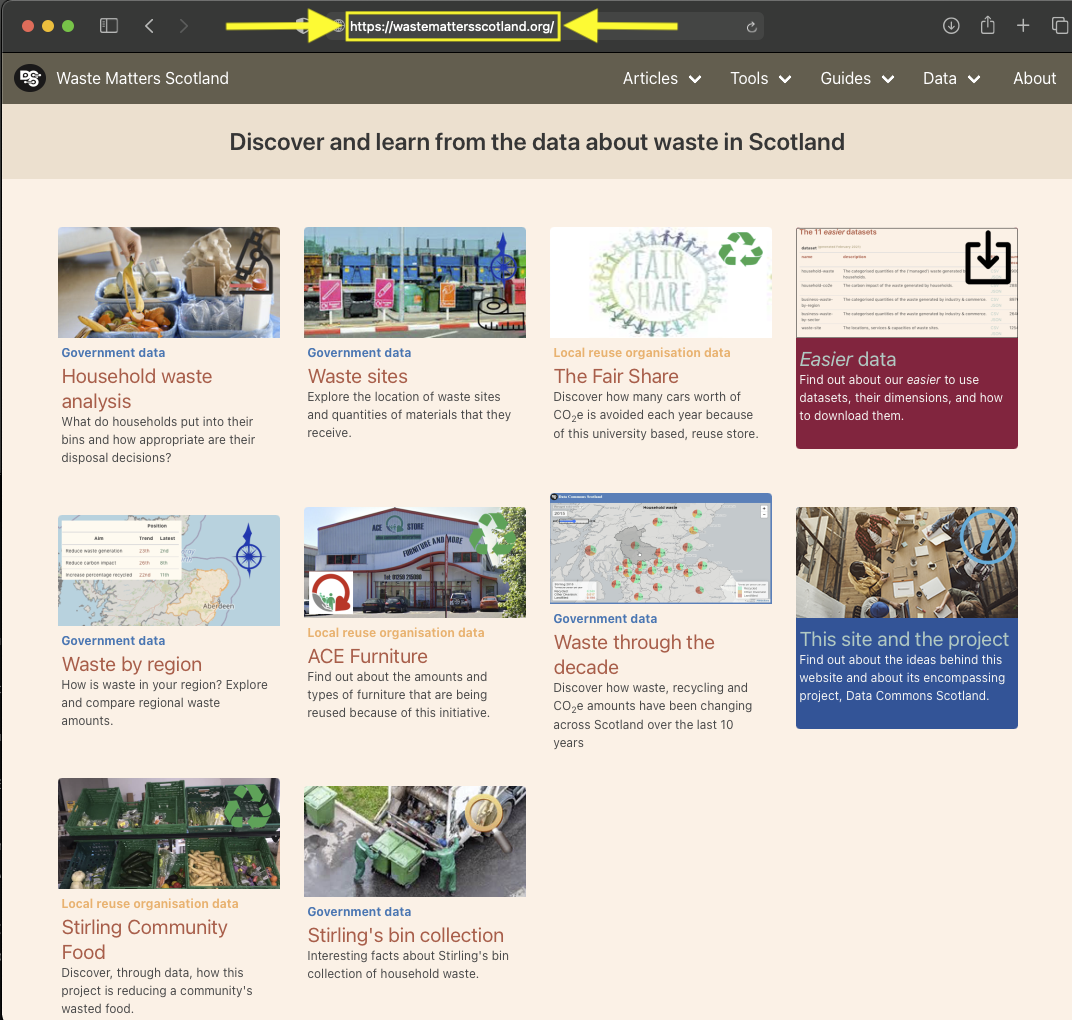
The Open Data Scotland website provides an up-to-date list of the Open Data resources about Scotland. It is being developed by the volunteer-run OD_BODS project team, and the idea for it originated from Ian Watt’s Scottish Open Data audit.

The website has been built using the JKAN framework which provides to end users, a ready-made search-the-datasets feature (try the search box near to the top of this page). However, its search can sometimes excessively exclude because it returns only those datasets whose metadata contain all of the search words, consecutively.

For instance, say that we wanted to find all datasets related to waste management. We might think of entering the search words: waste management recycl bin landfill dump tip. With JKAN, we would fairly much have to search for each of those words individually then collate the results.

Search tuning is its own whole field of research/area of business but, we have built a simple alternative to the JKAN search, to better support exploratory searching. Click on the image below to try the demo.


A animated GIF of an app to demo a simple alternative search over Open Data Scotland's dataset indexes

Stirling’s bin collection quantities per DataZone

A photograph by Lojze Jerala, of bins being emptied into a lorry in Ljubljana, Slovenia, 1959

This article is based on this programming notebook which provides more interactive detail.

👋 Introduction

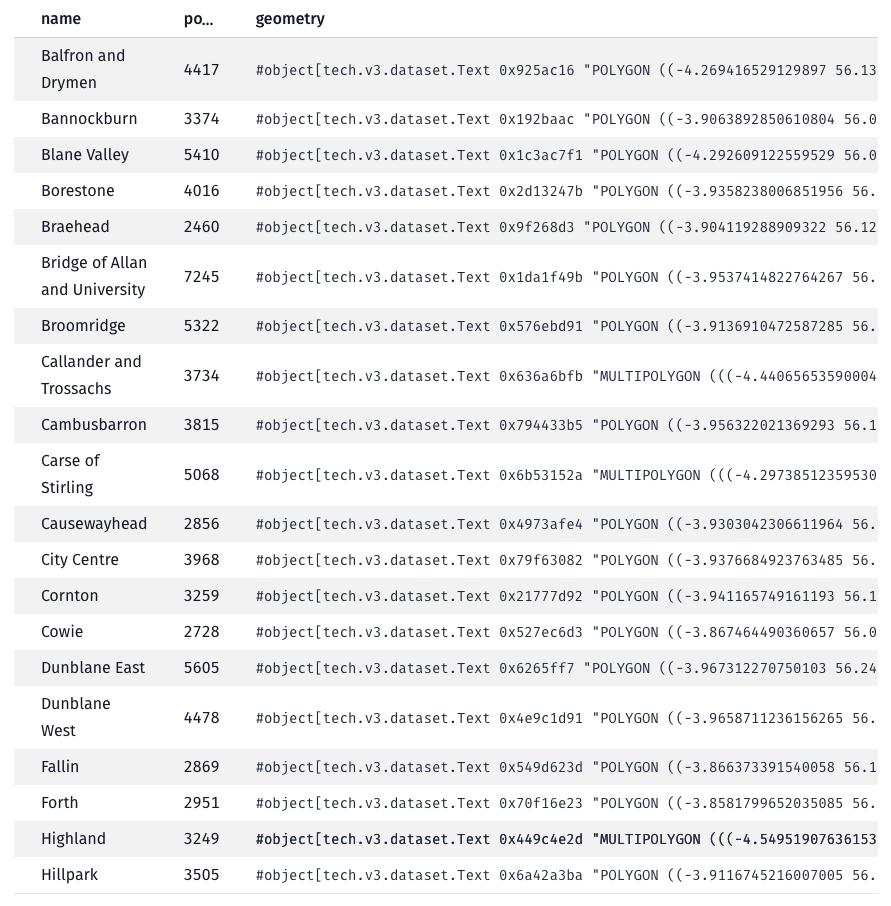
Stirling council has published Open Data about its bin collections. Its data for 2021 includes town/area names. Our aim is to approximately map this data onto DataZones to extract insights.

DataZones are well defined geographic areas that are associated with (statistical) data, such as population data. This makes them useful when comparing between geographically anchored, per-person quantities – like Stirling’s bin collection quantities.

We have used the term approximately because mapping the bin collections data to DataZonesis not simple and unamibiguous. For example, the data may say that a certain weight of binned material was collected in “Aberfoyle, Drymen, Balmaha, Croftamie, Balfron & Fintry narrow access areas“, and this needs to be aportioned across several DataZones. In cases like this, we will aportion the weight across the DataZones, based on relative populations of those DataZones. Will the resulting approximation be accurate enough to be useful?

📍 DataZones

Read the DataZones data from the Scottish government’s SPARQL endpoint

Each DataZone will have a name, a geographic boundary and a population.

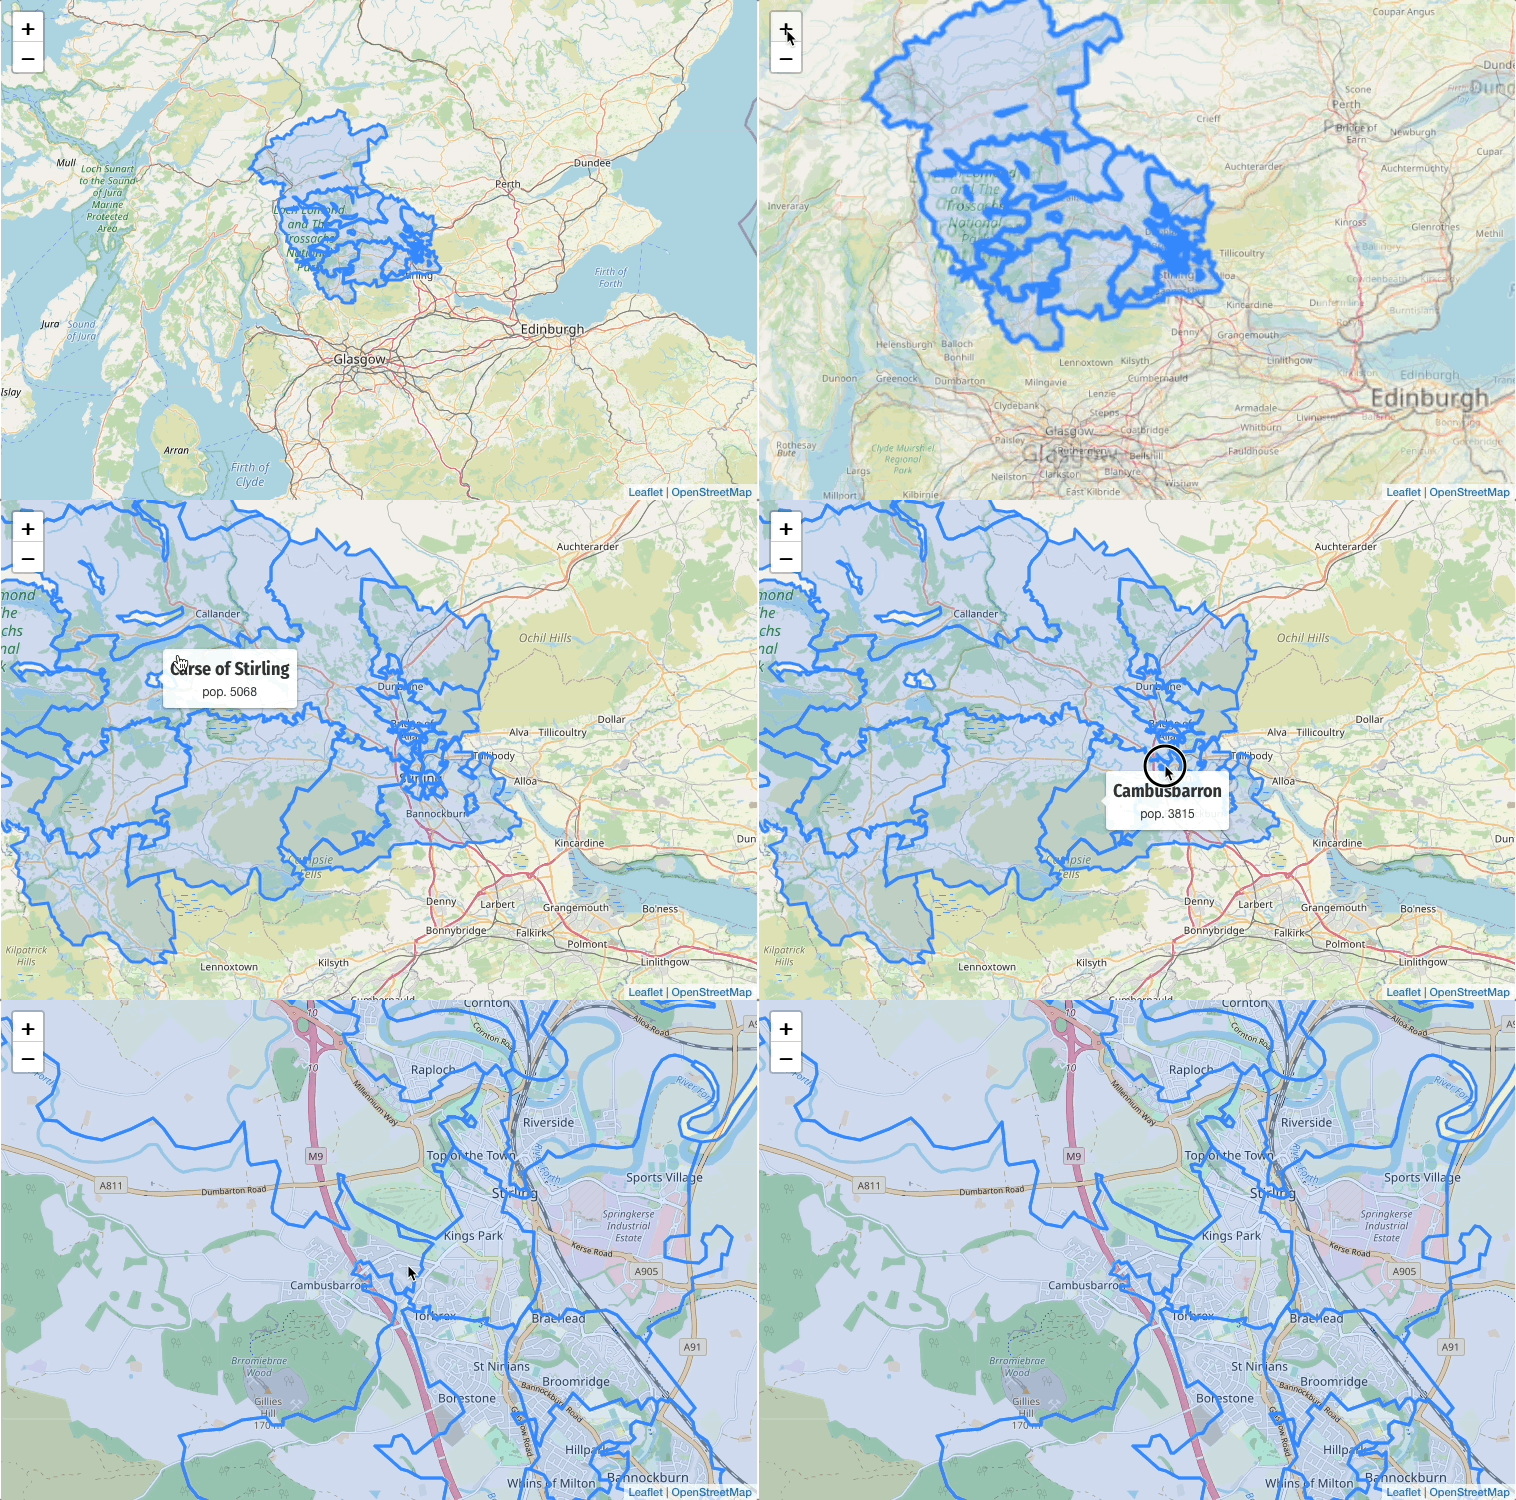
Plot the DataZones on a map

🚮 Bin collections

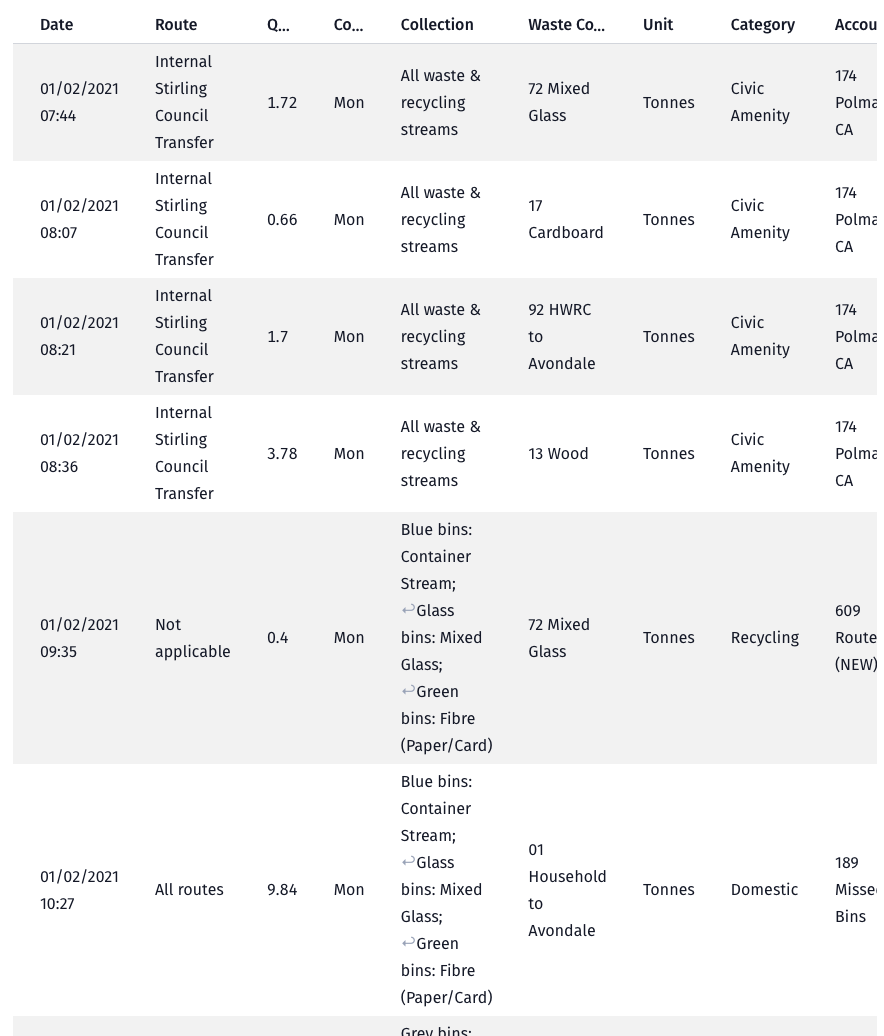
Read the bin collections data from Stirling council’s Open Data website

🗂️ Map bin collection routes to DataZones

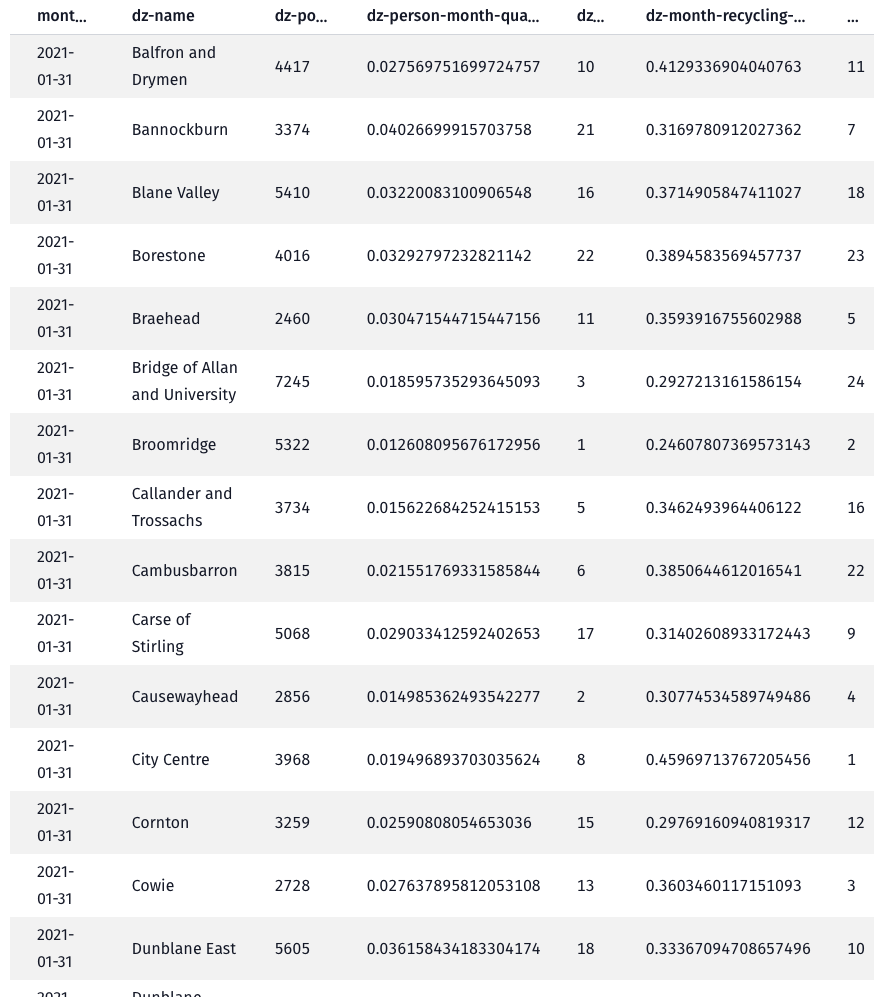
Apply a pipeline of data transformers/mappings to calculate the quantities per DataZone

📉 Plot the bin collection quantities per DataZone

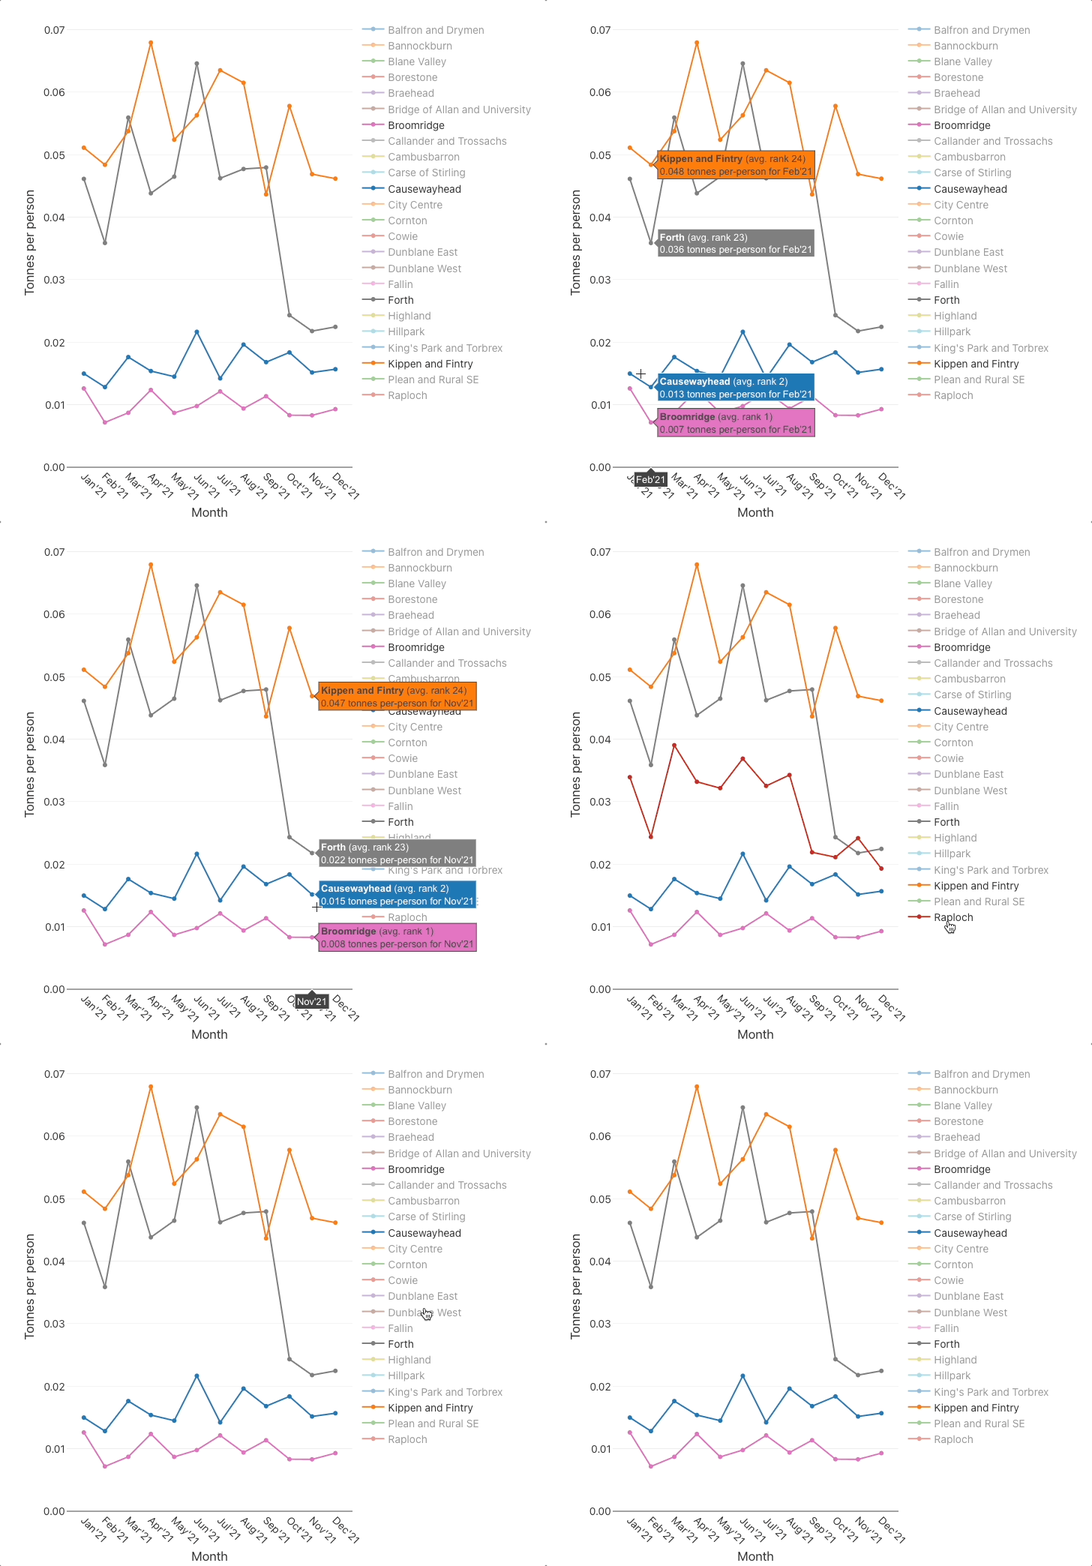
Plot the monthly per-person quantities

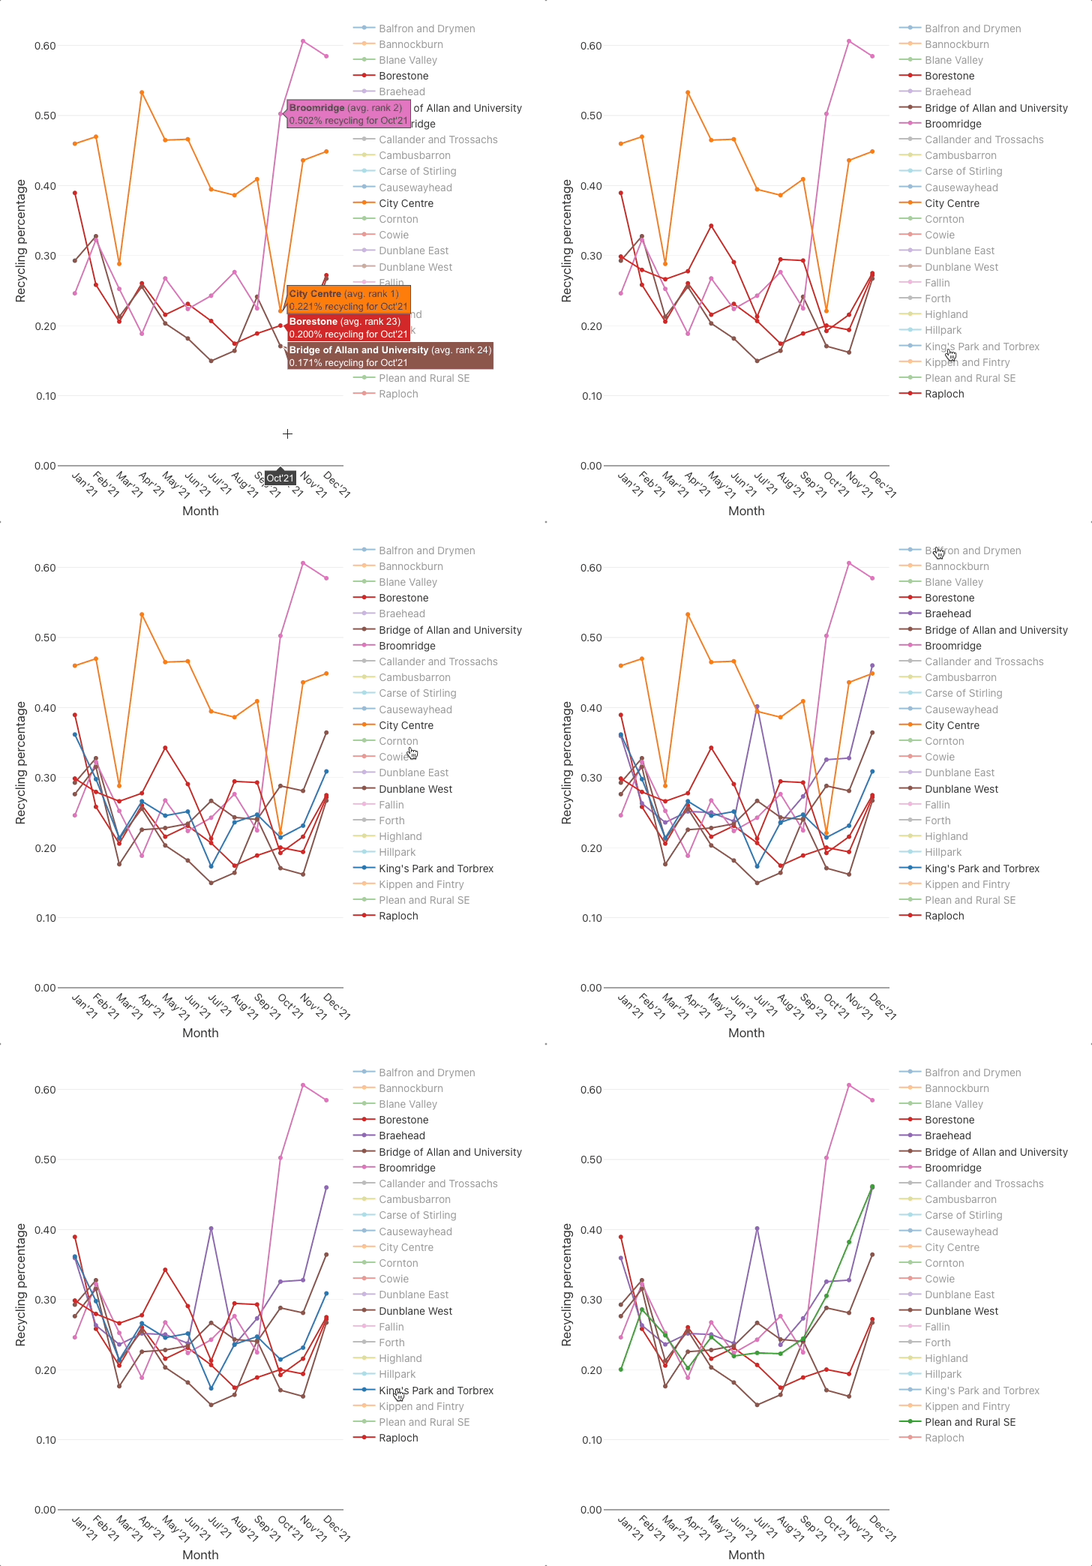
Plot the monthly recycling percentages

🤔 Conclusions

The charts suggest that there are substantial differences between some DataZones, for example:

  • the per-person quantities chart indicates that there is roughly a ×3 difference between the best (Broomridge) and worst (Kippen and Fintry) DataZones,
  • and the recycling percentages chart indicates that there is roughly a ×2 difference between the best (City Centre) and worst (Bridge of Allan and University) DataZones.

Are these differences real? Well, they are too significant to have arisen due to a few bad data points or mappings. Ok then, could the differences be due to systematic differences in the method used to categorise and measure bin collection quantities, between DataZones? That’s unlikely since many of the DataZones at both ends of the ranking share the same processing/measurement facility.

Most of the DataZones exhibit a step change in both charts around Aug'21Nov'21 where (the majority of) the monthly quantities collected decrease and the recycling percentages increase.This coincides with Stirling council’s change to a four-weekly bin collection for grey bins (general waste) and blue bins (plastics, cartons & cans), and its Recycle 4 Stirling campaign. It’s understandable that that specific change to bin collections increased recycling percentages, but it doesn’t explain the decrease in monthly quantities. Perhaps there was also a change in the method of measurement/accounting, or that households took more of their waste to landfill sites themselves(!), or was it (at least partly) caused by the change in season?

It is good that Stirling council have begun to publish this data as Open Data into the public domain. It will open future, data-backed possibilities as it grows in volume and (hopefully) increases in fidelity. So, Stirling council, please keep on publishing the data (but make it more DataZone-friendly!).

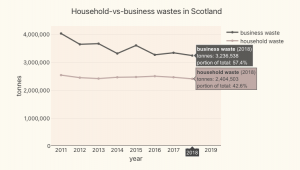
Household-vs-business wastes in Scotland during the last decade

Screenshot of the graph of household-vs-business cases in Scotland during the last decade

This graph provides an at-a-glance-comparison between Scotland’s households and businesses in respect of the yearly amounts waste that they have generated during the last decade.

The household:business ratio has been very approximately 2:3, but waste from businesses has been reducing noticeably over the decade.

Using a literate programming tool to generate content

Literate programming tools weave data, code, visualisations and natural language into a flowing narrative. These tools are often used to construct tutorial-style documents that are based on tractable/generatable material.

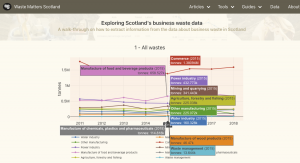
For us, this sounded like a promising approach as a way to generate content since, one of our aims is to develop (website situated) how-to guides/tutorials based on the tractable waste datasets. So we created our first tutorial-style document using this approach: A walk-through on how to extract information from the data about business waste in Scotland. Here’s a screenshot of it:Screenshot of our first document generated using a literate programming tool

It uses:
Only minimal mark-up and programming code was required (see its source file), and it has proved to be a handy means to generate a data-based tutorial.

Building linked open data about carbon savings

linked open data for carbon savings

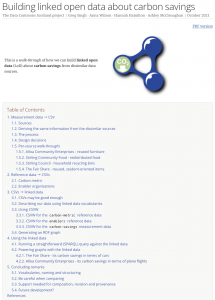
We have written a research report which walks through how we might build linked open data (LoD) about carbon savings from dissimilar data sources.

It outlines (using small samples from the datasets) how the data pipeline that feeds our prototype-6 webapp, works.

Building LoD about carbon savings - research report - coversheet

Data Commons Scotland at the SODU 2021 conference

Over the weekend (2-3 Sept 2021), I represented our DCS project at SODU 2021 – Scotland’s annual conference on Open Data.
Organised and run by the Code the City team, this event always provides a great opportunity to catch up with others in Scotland’s friendly Open Data community, and hear about their news.
This year, for me, its highlights included:
  • A “corridor chat” that began ad-hoc, about the preservation of railway history as represented by its data records (mostly paper based).That lead us to discuss Git persistence, the zeitgeist for shared ledger databases with explicit temporal support, and what all of that might mean for recording Open Data!
  • Then, a session on the perhaps more immediate concern of: how to nudge the government into making open, more of the data which it holds. Proposed was the neat idea of aggregating, curating and making searchable all of the responses arising from FOI-requests to local and national government. This would help highlight data that that the government should be making open by default.
  • And it was heartening to see representatives from the Scottish government’s Open Data team attending the conference and running an engaging session that brought together government and community perspectives. The government’s recent initiative to make public sector data easy to find” was one of the topics discussed.
  • The conference even gained an international dimension when two attendees joined us from Sweden to help run a live editing session on Wikidata, contributing to the project to add better data about Scottish government agencies into Wikidata.
  • Our own project received some valuable feedback after I demo-ed our latest prototype website.This wasn’t just all affirmative!… I got some useful insights into what what people found difficult. For example, I like the site’s tools and visualisations but, more needs to be done to help me navigate my path-of-interest through the prototype website“. This nicely ties in with one of our project’s (as yet unrealised) goals: to weave interest-based navigation maps through our data site.
I enjoyed the friendly SODU sessions over the weekend – it was inspiring to hear what others are contributing towards making data more open and accessible.
This year’s SODU was online because of Covid-19. Hopefully next year it will return to its more physical manifestation in Aberdeen city!

“What are my neighbours putting into their bins?!”

What do households put into their bins and and how appropriate are their disposal decisions?

To help provide an answer to that question, Zero Waste Scotland (ZWS) occasionally asks each of the 32 Scottish councils to sample their bin collections and to analyse their content. This compositional analysis uncovers the types and weights of the disposed of materials, and assesses the appropriateness of the disposal decisions (i.e. was it put into the right bin?).

Laudably, ZWS is considering publishing this data as open data. Click on the image below to see a web page that is based on an anonymised subset of this data.

household waste analysis

The Data Lab MSc data challenge event 2021

With Glasgow City hosting the UN Climate Change conference (COP26) later this year, it was appropriate that this year’s The Data Lab data analysis hackathon (held last week) had the theme “pollution reduction”.

Three organisations provided challenge projects for the hackathon teams: we provided a “waste management” project based on our easier-to-use datasets; Code the City provided an “air quality” project; and Scottish Power an “electric vehicle charging” project.

The hackathon was lead by a young Scottish tech start-up company called Filament. They have an interesting product that is basically a sharable, cloud-hosted Jupyter Notebook.

Each day a new cohort of teams would tackle the project challenges. We helped by answering their questions about our datasets, and by suggesting ideas for investigation.
At the end of each day the teams presented their findings.

It was informative to see how the teams (each with a mix of skills that included programming, data analysis and business acumen) organised themselves for group working, handled the data, and applied learned analysis techniques.

The teams had a relatively short amount of time to work on their projects so having easy to use datasets was a deciding factor in how much they could achieve. Therefore one take-away is clear, and helps substantiate an aim of our DCS project… open data needs to be easy to use, not just be accessible. Making data easier to use for non-experts, opens it to a much wider audience and to much more creativity.