Stirling’s bin collection quantities per DataZone

A photograph by Lojze Jerala, of bins being emptied into a lorry in Ljubljana, Slovenia, 1959

This article is based on this programming notebook which provides more interactive detail.

đź‘‹ Introduction

Stirling council has published Open Data about its bin collections. Its data for 2021 includes town/area names. Our aim is to approximately map this data onto DataZones to extract insights.

DataZones are well defined geographic areas that are associated with (statistical) data, such as population data. This makes them useful when comparing between geographically anchored, per-person quantities – like Stirling’s bin collection quantities.

We have used the term approximately because mapping the bin collections data to DataZonesis not simple and unamibiguous. For example, the data may say that a certain weight of binned material was collected in “Aberfoyle, Drymen, Balmaha, Croftamie, Balfron & Fintry narrow access areas“, and this needs to be aportioned across several DataZones. In cases like this, we will aportion the weight across the DataZones, based on relative populations of those DataZones. Will the resulting approximation be accurate enough to be useful?

đź“Ť DataZones

Read the DataZones data from the Scottish government’s SPARQL endpoint

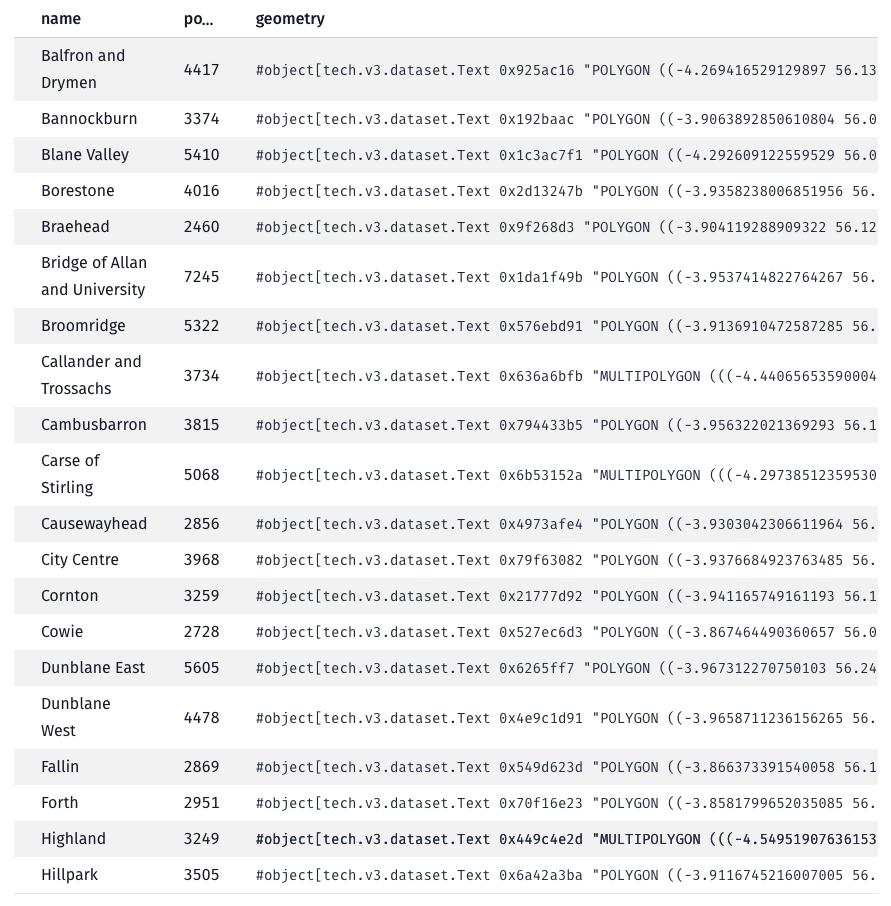
Each DataZone will have a name, a geographic boundary and a population.

Plot the DataZones on a map
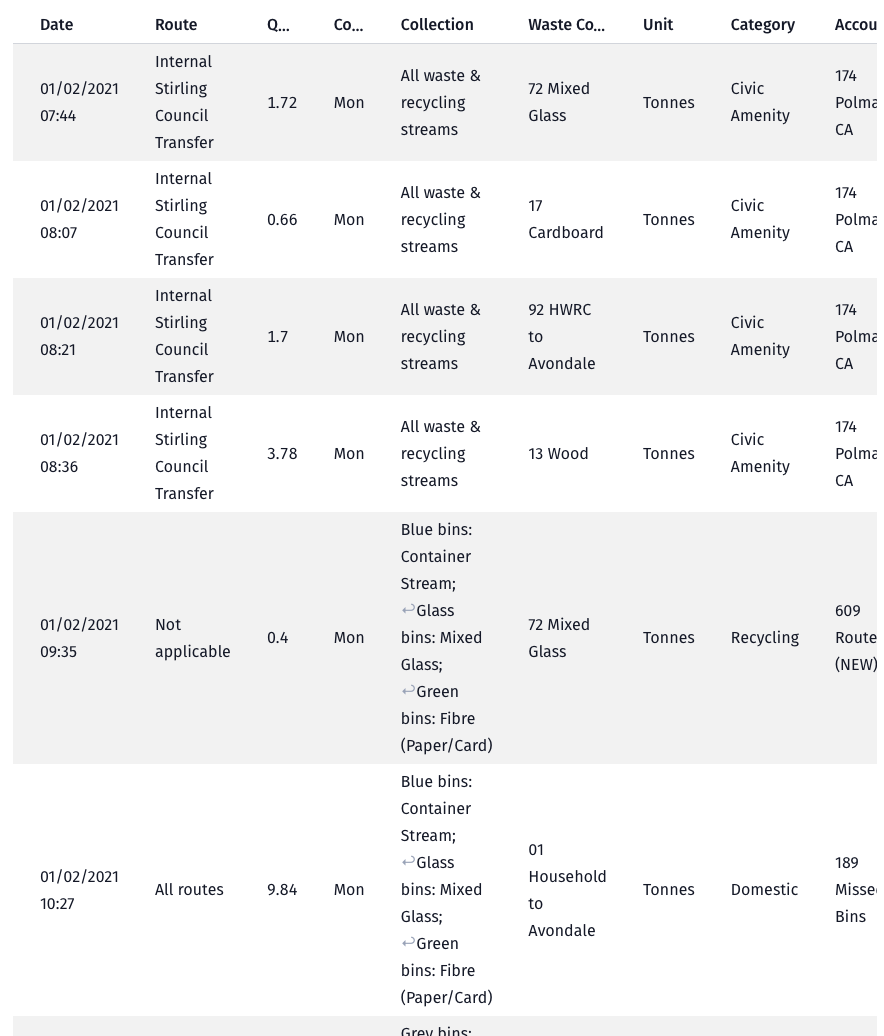
đźš® Bin collections

Read the bin collections data from Stirling council’s Open Data website

🗂️ Map bin collection routes to DataZones

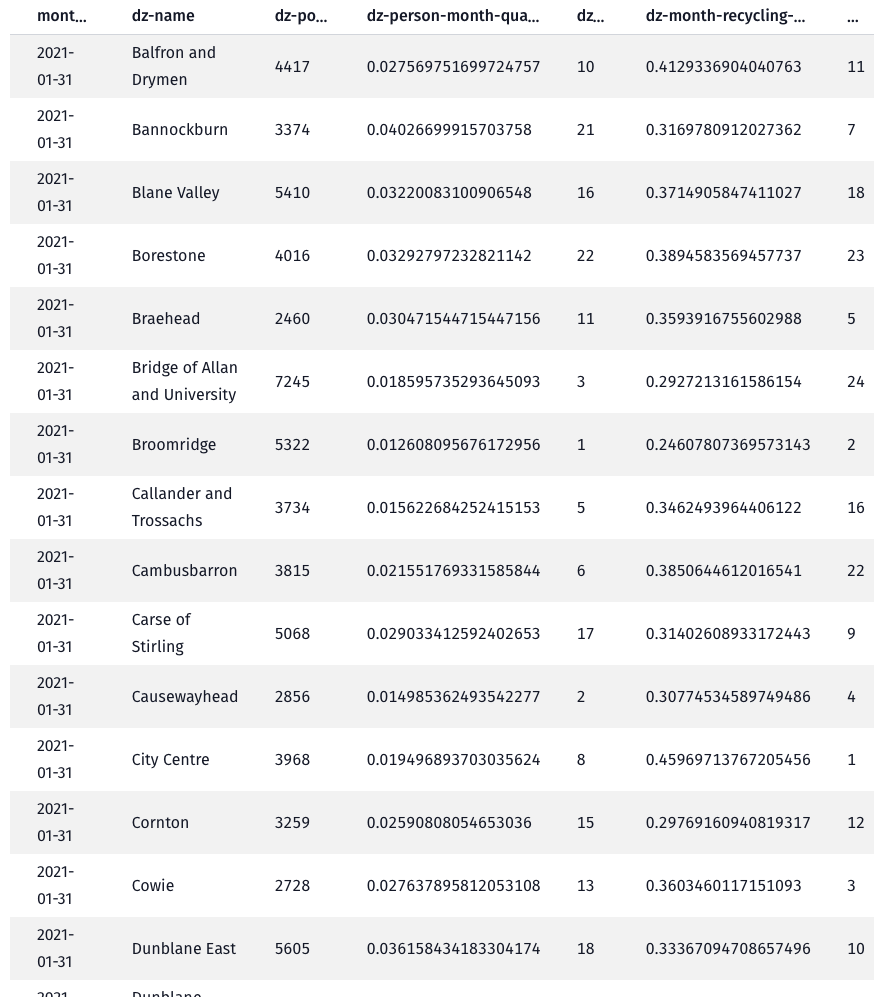
Apply a pipeline of data transformers/mappings to calculate the quantities per DataZone

📉 Plot the bin collection quantities per DataZone

Plot the monthly per-person quantities

Plot the monthly recycling percentages

🤔 Conclusions

The charts suggest that there are substantial differences between some DataZones, for example:

  • the per-person quantities chart indicates that there is roughly a Ă—3 difference between the best (Broomridge) and worst (Kippen and Fintry) DataZones,
  • and the recycling percentages chart indicates that there is roughly a Ă—2 difference between the best (City Centre) and worst (Bridge of Allan and University) DataZones.

Are these differences real? Well, they are too significant to have arisen due to a few bad data points or mappings. Ok then, could the differences be due to systematic differences in the method used to categorise and measure bin collection quantities, between DataZones? That’s unlikely since many of the DataZones at both ends of the ranking share the same processing/measurement facility.

Most of the DataZones exhibit a step change in both charts around Aug'21Nov'21 where (the majority of) the monthly quantities collected decrease and the recycling percentages increase.This coincides with Stirling council’s change to a four-weekly bin collection for grey bins (general waste) and blue bins (plastics, cartons & cans), and its Recycle 4 Stirling campaign. It’s understandable that that specific change to bin collections increased recycling percentages, but it doesn’t explain the decrease in monthly quantities. Perhaps there was also a change in the method of measurement/accounting, or that households took more of their waste to landfill sites themselves(!), or was it (at least partly) caused by the change in season?

It is good that Stirling council have begun to publish this data as Open Data into the public domain. It will open future, data-backed possibilities as it grows in volume and (hopefully) increases in fidelity. So, Stirling council, please keep on publishing the data (but make it more DataZone-friendly!).

Annotating data points on our prototype website

On our requirements list is, to weave interest-based navigation maps through our data site. And feedback from the recent SODU 2021 conference, affirmed this:

I like the site’s tools and visualisations, but more needs to be done to help me navigate my path of interest through the prototype website.

In an exploratory step towards fulfilling that requirement, we have annotated some data points with explanations/narrative. The idea is that that these annotations could become waymarks in navigation maps, to guide users between the datapoints which underpin data-based stories. We might even imagine how clicking a ‘next’ button on a waymark would visually ‘fly’ the user to the next datapoint in the story (which is, perhaps, on a different graph or different page). But(!) back to our present, very simple proof-of-concept implementation…​

Here’s how the annotations look in our present, proof-of-concept implementation:

Annotations plotted on Inverclyde’s household waste generated graph

Each annotation is depicted by an emoji which is plotted beside a datapoint (on a graph, or in a table). When the user hovers over (or clicks on) an annotation’s emoji, a pop-up will display some informative text.

We want to code annotations just as we would any other dataset – as a straighforward CSV file. So we have built a data-drive annotation mechanism. This has allowed us to specify annotations, as data, in a CSV file like this:

Annotations specified in a CSV data file

Each annotation record contains datapoint coordinates which specify the datapoint against which the annotation is to be plotted. The datapoint coordinates include a record-type which specifies the dataset against which the annotation is to be plotted. (In this example, the specified dataset household-waste-derivation-generation is a derived dataset, based on the household-waste and population datasets.)

This proof-of-concept, data-driven, annotation mechanism has been useful because it has:

  1. given us a model with moving parts to learn from,

  2. provided hints about how annotations can be used to help users understand and navigate the data,

  3. shown us that we need more structure around the naming and storage of derived datasets (and their annotations), and

  4. uncovered the difficultlies of retro-fitting an annotations mechanism into our prototype-6 website. (Annotations are displayed using off-the-shelf Vega-lite tooltips and Bulma CSS dropdowns, but these don’t provide a satisfactory level of placement/control/interactivity. More customised webpage components will be needed to provide a better user experience.)

“What are my neighbours putting into their bins?!”

What do households put into their bins and and how appropriate are their disposal decisions?

To help provide an answer to that question, Zero Waste Scotland (ZWS) occasionally asks each of the 32 Scottish councils to sample their bin collections and to analyse their content. This compositional analysis uncovers the types and weights of the disposed of materials, and assesses the appropriateness of the disposal decisions (i.e. was it put into the right bin?).

Laudably, ZWS is considering publishing this data as open data. Click on the image below to see a web page that is based on an anonymised subset of this data.

household waste analysis

The Fair Share – the CO2e saved by this university based, reuse store

Discover how many cars worth of CO2e is avoided each year because of this university based, reuse store

The Fair Share is a university based, reuse store. It accepts donations of second-hand books, clothes, kitchenware, electricals, etc. and sells these to students. It is run by the Student Union at the University of Stirling. It meets the Revolve quality standard for second-hand stores.

The Fair Share is in the process of publishing its data as open data. Click on the image below to see a web page that is based on an draft of that work.

The Fair Share

The Data Lab MSc data challenge event 2021

With Glasgow City hosting the UN Climate Change conference (COP26) later this year, it was appropriate that this year’s The Data Lab data analysis hackathon (held last week) had the theme “pollution reduction”.

Three organisations provided challenge projects for the hackathon teams: we provided a “waste management” project based on our easier-to-use datasets; Code the City provided an “air quality” project; and Scottish Power an “electric vehicle charging” project.

The hackathon was lead by a young Scottish tech start-up company called Filament. They have an interesting product that is basically a sharable, cloud-hosted Jupyter Notebook.

Each day a new cohort of teams would tackle the project challenges. We helped by answering their questions about our datasets, and by suggesting ideas for investigation.
At the end of each day the teams presented their findings.

It was informative to see how the teams (each with a mix of skills that included programming, data analysis and business acumen) organised themselves for group working, handled the data, and applied learned analysis techniques.

The teams had a relatively short amount of time to work on their projects so having easy to use datasets was a deciding factor in how much they could achieve. Therefore one take-away is clear, and helps substantiate an aim of our DCS project… open data needs to be easy to use, not just be accessible. Making data easier to use for non-experts, opens it to a much wider audience and to much more creativity.

Stirling’s bin collection data – revisited

Stirling Council set a precedent by being the first (and still only) Scottish local authority to have published open data about their bin collection of household waste.

The council are currently working on increasing the fidelity of this dataset, e.g. by adding spatial data to describe collection routes. However, we can still squeeze from its current version, several interesting pieces of information. For details, visit the Stirling bin collection page on our website mockup.

“How is waste in my area?” – a regional dashboard

Introduction

Our aim in this piece of work is:

to surface facts of interest (maximums, minimums, trends, etc.) about waste in an area, to non-experts.

Towards that aim, we have built a prototype regional dashboard which is directly powered by our ‘easier datasets’ about waste.

The prototype is a webapp and it can be accessed here.

our prototype regional dashboard

Curiosities

Even this early prototype manages to surface some curiosities [1] …​

Inverclyde

Inverclyde is doing well.

Inverclyde’s household waste positions Inverclyde’s household waste generation Inverclyde’s household waste CO2e

In the latest data (2019), it generates the fewest tonnes of household waste (per citizen) of any of the council areas. And its same 1st position for CO2e indicates the close relation between the amount of waste generated and its carbon impact.

…​But why is Inverclyde doing so well?

Highland

Highland isn’t doing so well.

Highland’s household waste positions Highland’s household waste generation Highland’s household waste % recycled

In the latest data (2019), it generates the most (except for Argyll & Bute) tonnes of household waste (per citizen) of any of the council areas. And it has the worst trend for percentage recycled.

…​Why is Highland’s percentage recycled been getting worse since 2014?

Fife

Fife has the best trend for household waste generation. That said, it still has been generating an above the average amount of waste per citizen.

Fife’s household waste positions Fife’s household waste generation

The graphs for Fife business waste show that there was an acute reduction in combustion wastes in 2016.

Fife’s business waste

We investigated this anomaly before and discovered that it was caused by the closure of Fife’s coal fired power station (Longannet) on 24th March 2016.

Angus

In the latest two years of data (2018 & 2019), Angus has noticibly reduced the amount of household waste that it landfills.

Angus' household waste management

During the same period, Angus has increased the amount household waste that it processes as ‘other diversion’.

…​What underlies that difference in Angus’ waste processing?

Technologies

This prototype is built as a ‘static’ website with all content-dynamics occurring in the browser. This makes it simple and cheap to host, but results in heavier, more complex web pages.

  • The clickable map is implemented on Leaflet – with Open Street Map map tiles.
  • The charts are constructed using Vega-lite.
  • The content-dynamics are coded in ClojureScript – with Hiccup for HTML, and Reagent for events.
  • The website is hosted on GitHub.

Ideas for evolving this prototype

  1. Provide more qualitative information. This version is quite quantitative because, well, that is nature of the datasets that currently underlay it. So there’s a danger of straying into the “managment by KPI” approach when we should be supporting the “management by understanding” approach.
  2. Include more localised information, e.g. about an area’s re-use shops, or bin collection statistics.
  3. Support deeper dives, e.g. so that users can click on a CO2e trend to navigate to a choropleth map for CO2e.
  4. Allow users to download any of the displayed charts as (CSV) data or as (PNG) images.
  5. Enhance the support of comparisons by allowing users to multi-select regions and overlay their charts.
  6. Allow users to choose from a menu, what chart/data tiles to place on the page.
  7. Provide a what-if? tool. “What if every region reduced by 10% their landfilling of waste material xyz?” – where the tool has a good enough waste model to enable it to compute what-if? outcomes.

1. One of the original sources of data has been off-line due to a cyberattack so, at the time of writing, it has not been possible to double-check all figures from our prototype against original sources.

‘Easier’ open data about waste in Scotland

Objective

Several organisations are doing a very good job of curating & publishing open data about waste in Scotland but, the published data is not always “easy to use” for non-experts. We have see several references to this at open data conference events and on social media platforms:

Whilst statisticians/coders may think that it is reasonably simple to knead together these somewhat diverse datasets into a coherent knowledge, the interested layman doesn’t find it so easy.

One of the objectives of the Data Commons Scotland project is to address the “ease of use” issue over open data. The contents of this repository are the result of us re-working some of the existing source open data so that it is easier to use, understand, consume, parse, and all in one place. It may not be as detailed or have all the nuances as the source data – but aims to be better for the purposes of making the information accessible to non-experts.

We have processed the source data just enough to:

  • provide value-based cross-referencing between datasets
  • add a few fields whose values are generally useful but not easily derivable by a simple calculation (such as latitude & longitude)
  • make it available as simple CSV and JSON files in a Git repository.

We have not augmented the data with derived values that can be simply calculated, such as per-population amounts, averages, trends, totals, etc.

The 10 easier datasets

dataset (generated February 2021) source data (sourced January 2021)
name description file number of records creator supplier licence
household-waste The categorised quantities of the (‘managed’) waste generated by households. CSV JSON 19008 SEPA statistics.gov.scot URL OGL v3.0
household-co2e The carbon impact of the waste generated by households. CSV JSON 288 SEPA SEPA URL OGL v2.0
business-waste-by-region The categorised quantities of the waste generated by industry & commerce. CSV JSON 8976 SEPA SEPA URL OGL v2.0
business-waste-by-sector The categorised quantities of the waste generated by industry & commerce. CSV JSON 2640 SEPA SEPA URL OGL v2.0
waste-site The locations, services & capacities of waste sites. CSV JSON 1254 SEPA SEPA URL OGL v2.0
waste-site-io The categorised quantities of waste going in and out of waste sites. CSV 2667914 SEPA SEPA URL OGL v2.0
material-coding A mapping between the EWC codes and SEPA’s materials classification (as used in these datasets). CSV JSON 557 SEPA SEPA URL OGL v2.0
ewc-coding EWC (European Waste Classification) codes and descriptions. CSV JSON 973 European Commission of the EU Publications Office of the EU URL CC BY 4.0
households Occupied residential dwelling counts. Useful for calculating per-household amounts. CSV JSON 288 NRS statistics.gov.scot URL OGL v3.0
population People counts. Useful for calculating per-citizen amounts. CSV JSON 288 NRS statistics.gov.scot URL OGL v3.0

(The fuller, CSV version of the table above.)

The dimensions of the easier datasets

One of the things that makes these datasets easier to use, is that they use consistent dimensions values/controlled code-lists. This makes it easier to join/link datasets.

So we have tried to rectify the inconsistencies that occur in the source data (in particular, the inconsistent labelling of waste materials and regions). However, this is still “work-in-progress” and we yet to tease out & make consistent further useful dimensions.

dimension description dataset example value of dimension count of values of dimension min value of dimension max value of dimension
region The name of a council area. household-waste Falkirk 32
household-co2e Aberdeen City 32
business-waste-by-region Falkirk 34
waste-site North Lanarkshire 32
households West Dunbartonshire 32
population West Dunbartonshire 32
business-sector The label representing the business/economic sector. business-waste-by-sector Manufacture of food and beverage products 10
year The integer representation of a year. household-waste 2011 9 2011 2019
household-co2e 2013 9 2011 2019
business-waste-by-region 2011 8 2011 2018
business-waste-by-sector 2011 8 2011 2018
waste-site 2019 1 2019 2019
waste-site-io 2013 14 2007 2020
households 2011 9 2011 2019
population 2013 9 2011 2019
quarter The integer representation of the year’s quarter. waste-site-io 4 4
site-name The name of the waste site. waste-site Bellshill H/care Waste Treatment & Transfer 1246
permit The waste site operator’s official permit or licence. waste-site PPC/A/1180708 1254
waste-site-io PPC/A/1000060 1401
status The label indicating the open/closed status of the waste site in the record’s timeframe. waste-site Not applicable 4
latitude The signed decimal representing a latitude. waste-site 55.824871489601804 1227
longitude The signed decimal representing a longitude. waste-site -4.035165962797409 1227
io-direction The label indicating the direction of travel of the waste from the PoV of a waste site. waste-site-io in 2
material The name of a waste material in SEPA’s classification. household-waste Animal and mixed food waste 22
business-waste-by-region Spent solvents 33
business-waste-by-sector Spent solvents 33
material-coding Acid, alkaline or saline wastes 34
management The label indicating how the waste was managed/processed (i.e. what its end-state was). household-waste Other Diversion 3
ewc-code The code from the European Waste Classification hierarchy. waste-site-io 00 00 00 787
material-coding 11 01 06* 557
ewc-coding 01 973
ewc-description The description from the European Waste Classification hierarchy. ewc-coding WASTES RESULTING FROM EXPLORATION, MINING, QUARRYING, AND PHYSICAL AND CHEMICAL TREATMENT OF MINERALS 774
operator The name of the waste site operator. waste-site TRADEBE UK 753
activities The waste processing activities supported by the waste site. waste-site Other treatment 50
accepts The kinds of clients/wastes accepted by the waste site. waste-site Other special 42
population The population count as an integer. population 89800 21420 633120
households The households count as an integer. households 42962 9424 307161
tonnes The waste related quantity as a decimal. household-waste 0 0 183691
household-co2e 251386.54 24768.53 762399.92
business-waste-by-region 753 0 486432
business-waste-by-sector 54 0 1039179
waste-site-io 0 -8.56 2325652.83
tonnes-input The quantity of incoming waste as a decimal. waste-site 154.55 0 1476044
tonnes-treated-recovered The quantity of waste treated or recovered as a decimal. waste-site 133.04 0 1476044
tonnes-output The quantity of outgoing waste as a decimal. waste-site 152.8 0 235354.51

(The CSV version of the table above.)