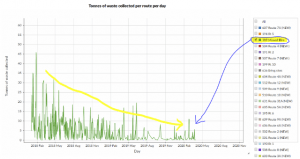
Stirling’s bin collection quantities per DataZone

A photograph by Lojze Jerala, of bins being emptied into a lorry in Ljubljana, Slovenia, 1959

This article is based on this programming notebook which provides more interactive detail.

👋 Introduction

Stirling council has published Open Data about its bin collections. Its data for 2021 includes town/area names. Our aim is to approximately map this data onto DataZones to extract insights.

DataZones are well defined geographic areas that are associated with (statistical) data, such as population data. This makes them useful when comparing between geographically anchored, per-person quantities – like Stirling’s bin collection quantities.

We have used the term approximately because mapping the bin collections data to DataZonesis not simple and unamibiguous. For example, the data may say that a certain weight of binned material was collected in “Aberfoyle, Drymen, Balmaha, Croftamie, Balfron & Fintry narrow access areas“, and this needs to be aportioned across several DataZones. In cases like this, we will aportion the weight across the DataZones, based on relative populations of those DataZones. Will the resulting approximation be accurate enough to be useful?

📍 DataZones

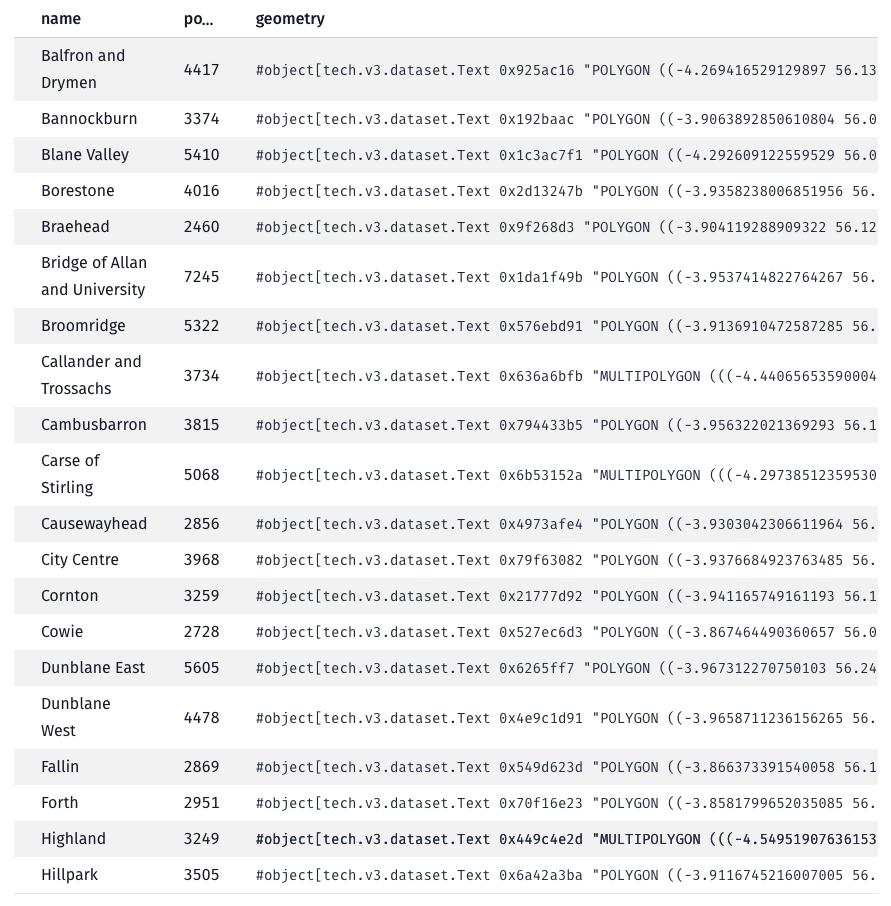
Read the DataZones data from the Scottish government’s SPARQL endpoint

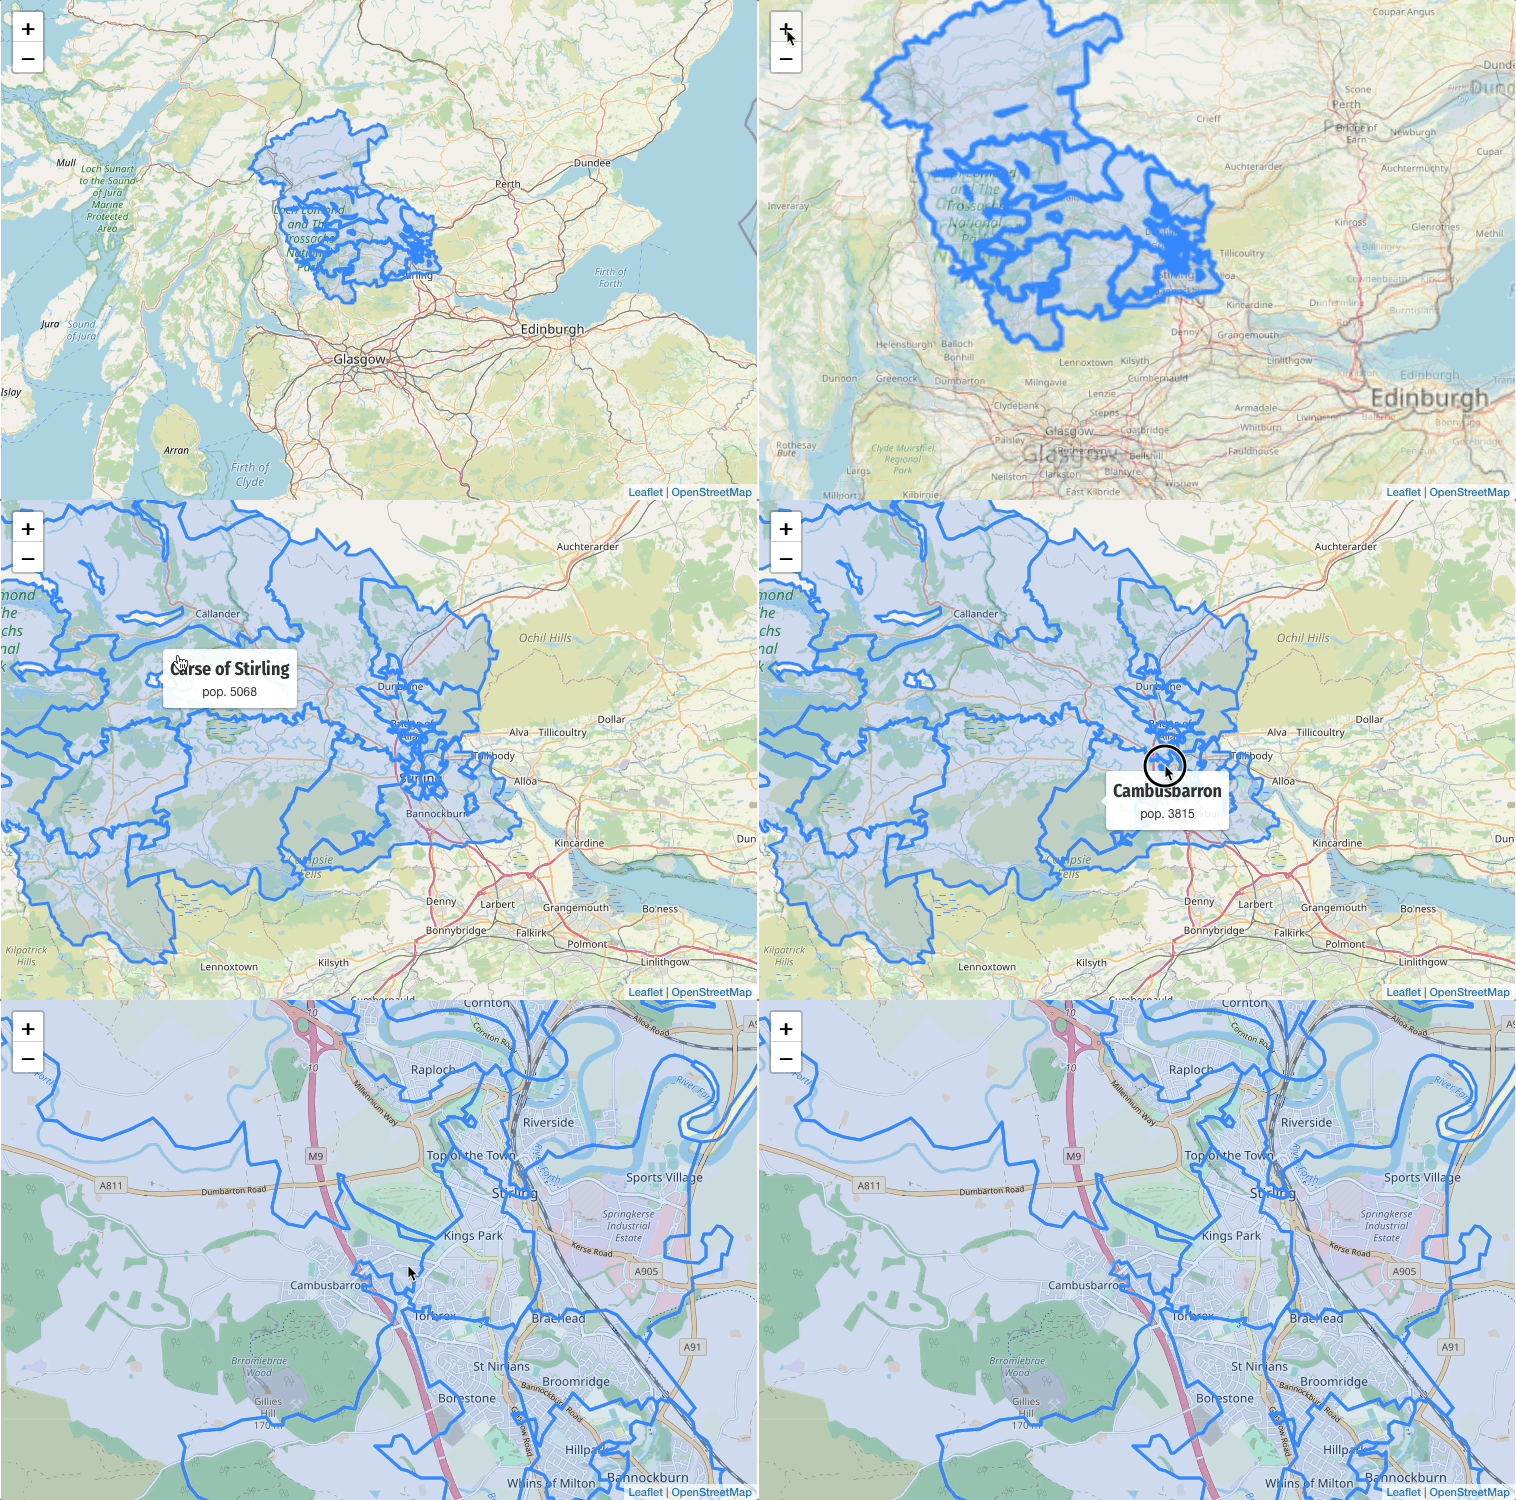
Each DataZone will have a name, a geographic boundary and a population.

Plot the DataZones on a map

🚮 Bin collections

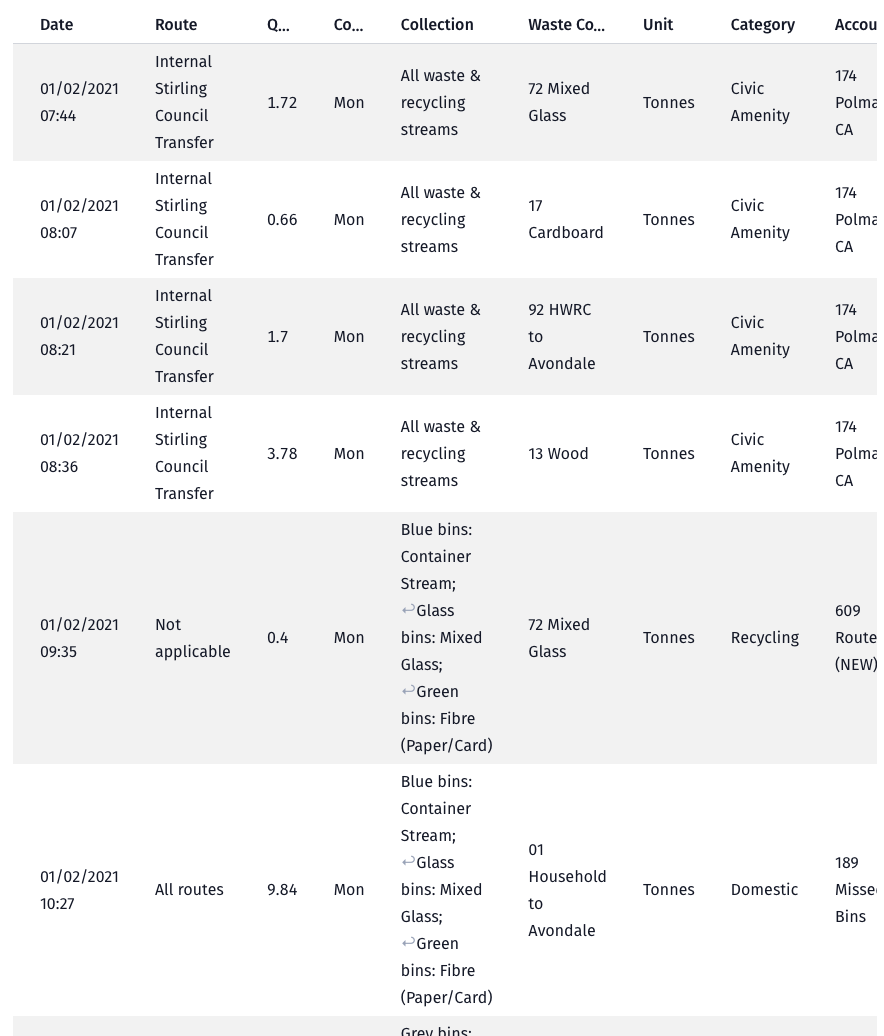
Read the bin collections data from Stirling council’s Open Data website

🗂️ Map bin collection routes to DataZones

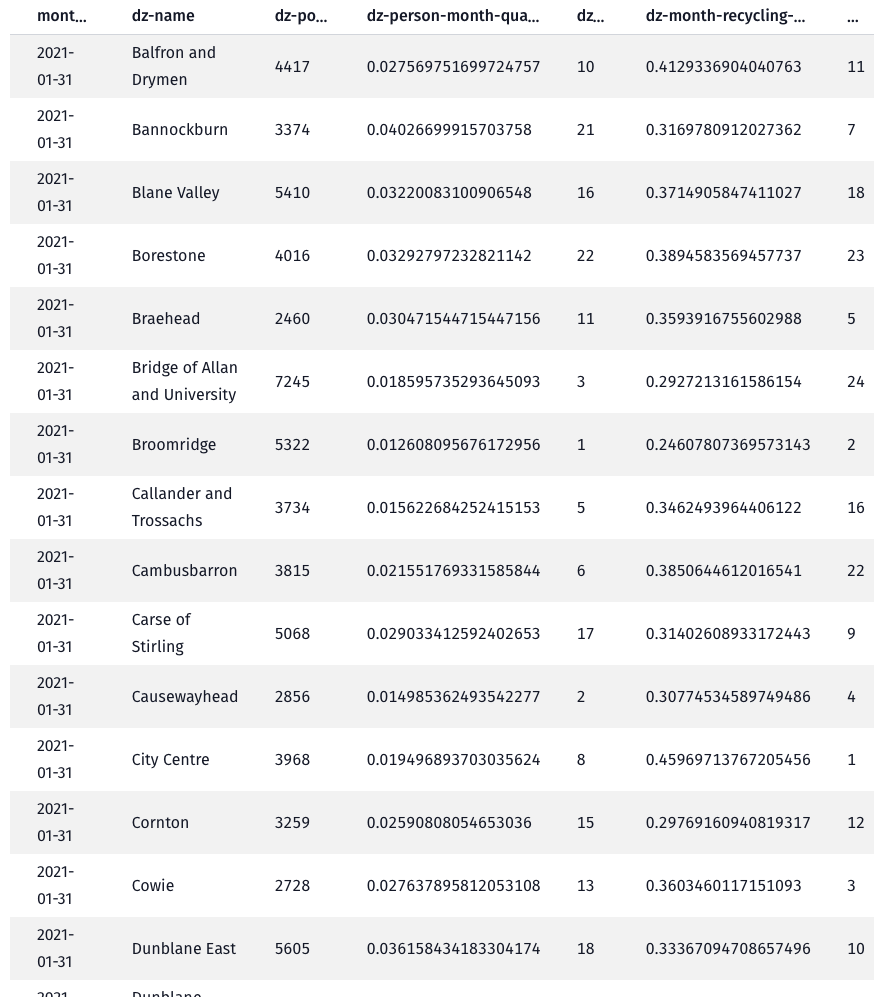
Apply a pipeline of data transformers/mappings to calculate the quantities per DataZone

📉 Plot the bin collection quantities per DataZone

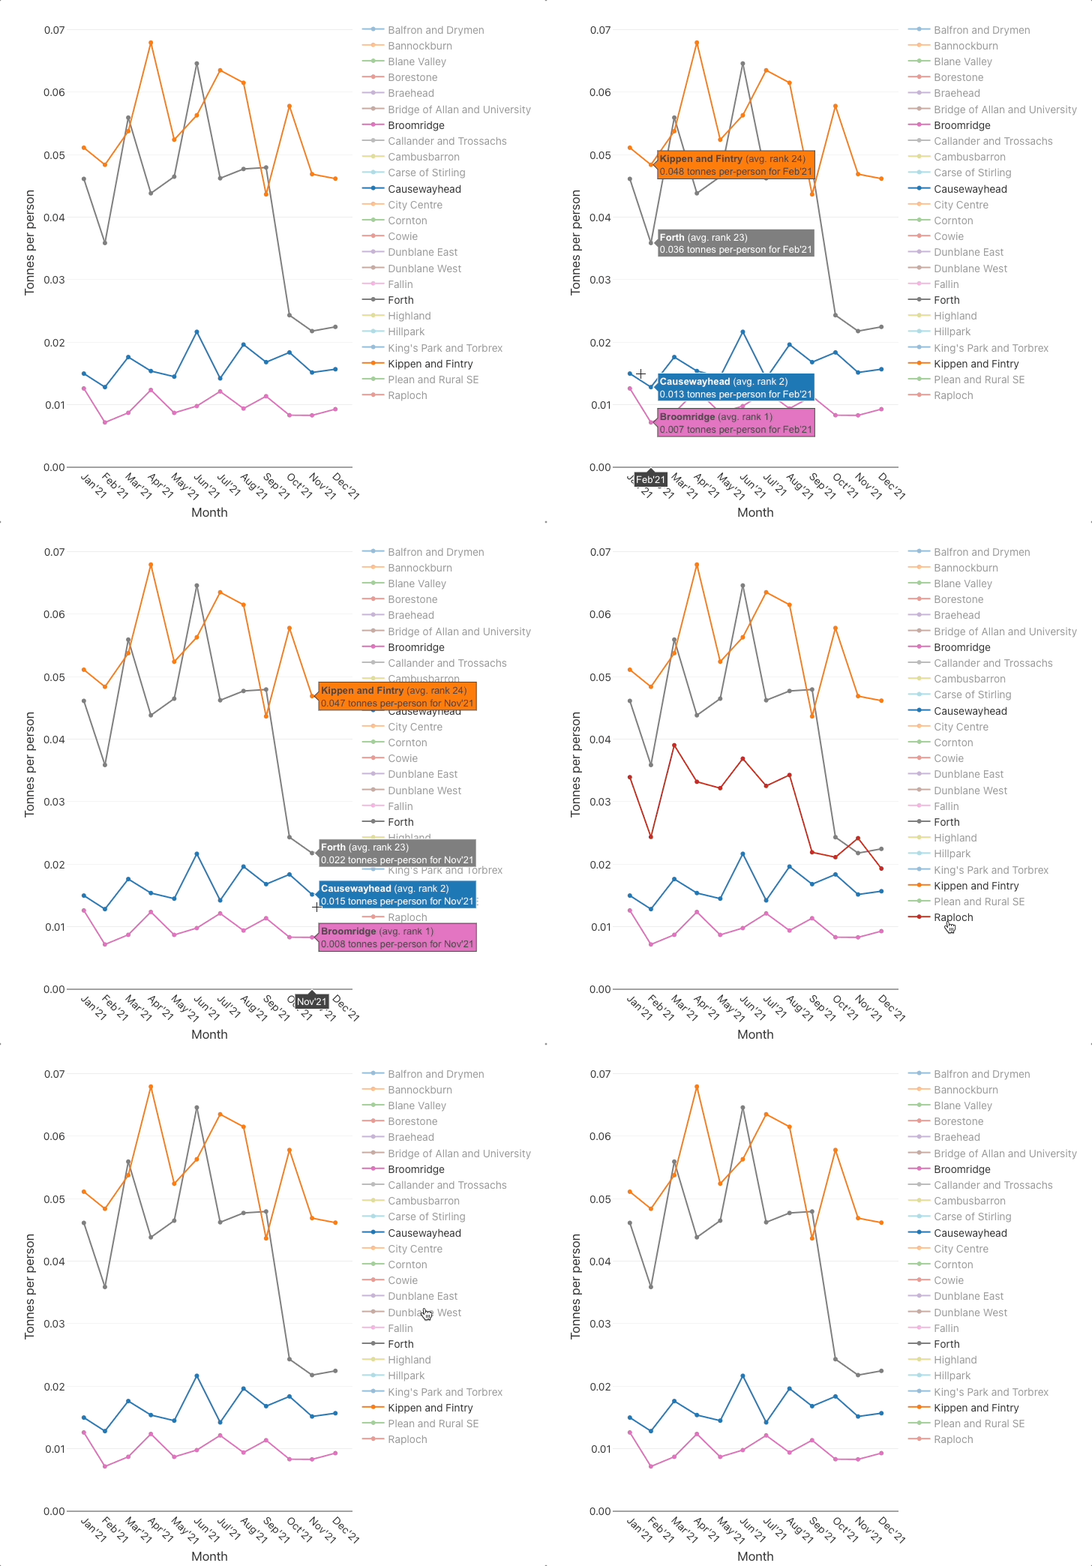
Plot the monthly per-person quantities

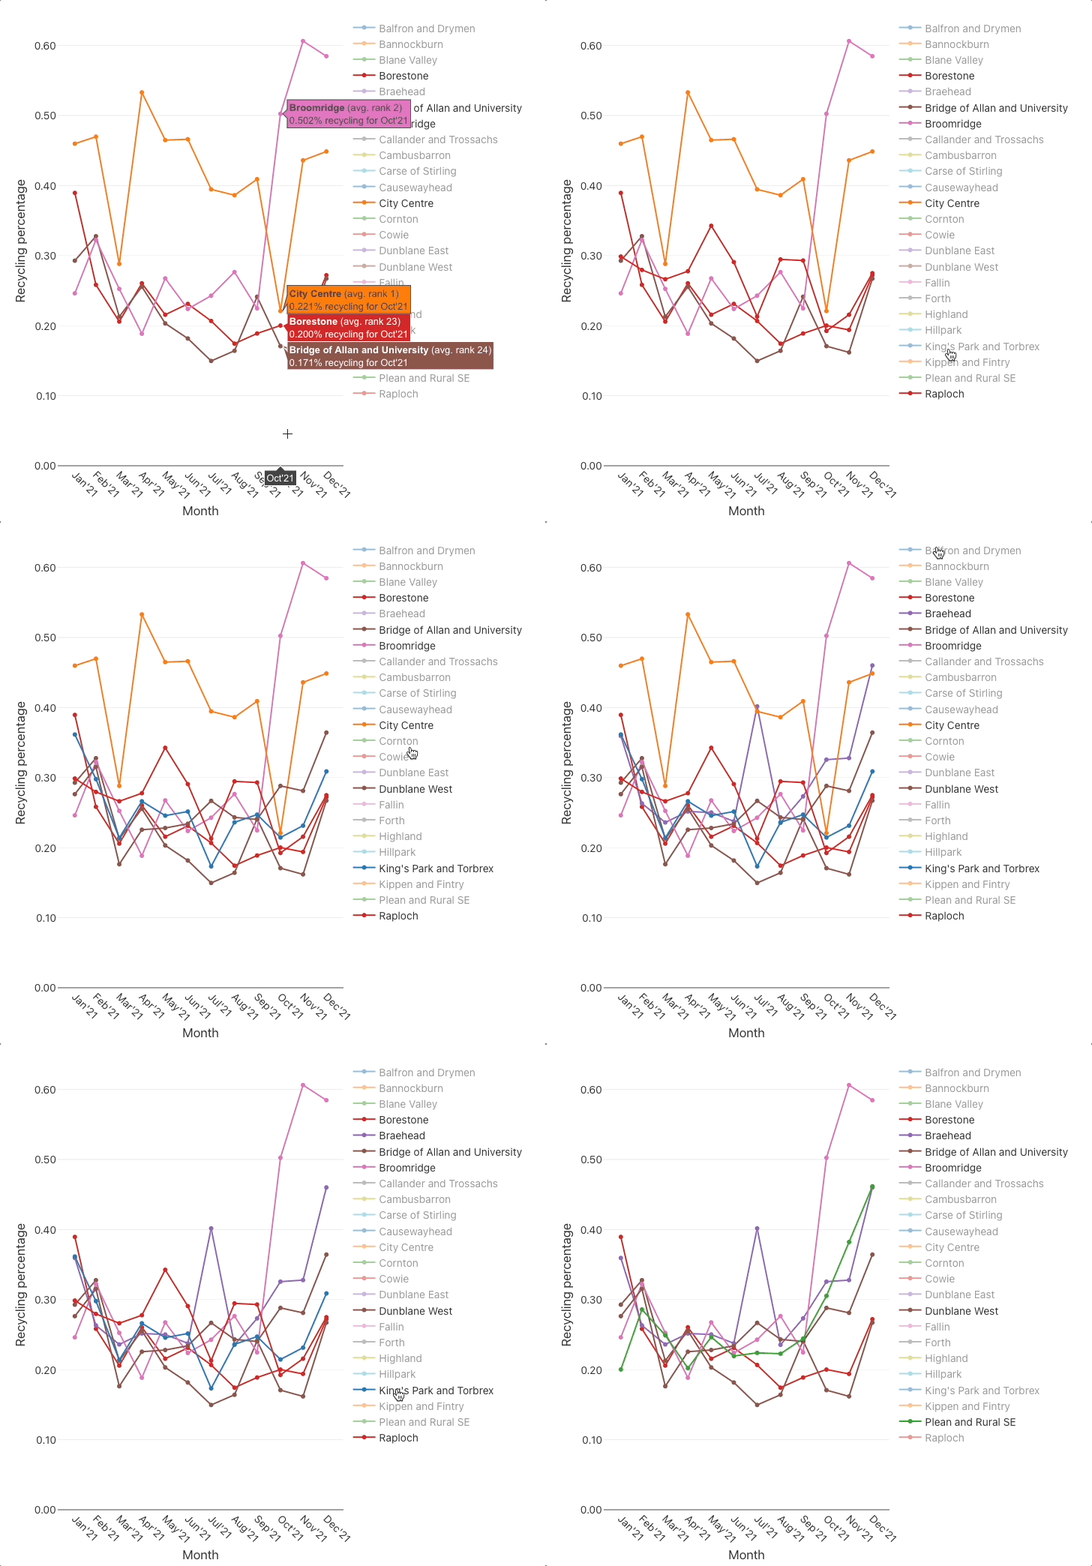
Plot the monthly recycling percentages

🤔 Conclusions

The charts suggest that there are substantial differences between some DataZones, for example:

  • the per-person quantities chart indicates that there is roughly a ×3 difference between the best (Broomridge) and worst (Kippen and Fintry) DataZones,
  • and the recycling percentages chart indicates that there is roughly a ×2 difference between the best (City Centre) and worst (Bridge of Allan and University) DataZones.

Are these differences real? Well, they are too significant to have arisen due to a few bad data points or mappings. Ok then, could the differences be due to systematic differences in the method used to categorise and measure bin collection quantities, between DataZones? That’s unlikely since many of the DataZones at both ends of the ranking share the same processing/measurement facility.

Most of the DataZones exhibit a step change in both charts around Aug'21Nov'21 where (the majority of) the monthly quantities collected decrease and the recycling percentages increase.This coincides with Stirling council’s change to a four-weekly bin collection for grey bins (general waste) and blue bins (plastics, cartons & cans), and its Recycle 4 Stirling campaign. It’s understandable that that specific change to bin collections increased recycling percentages, but it doesn’t explain the decrease in monthly quantities. Perhaps there was also a change in the method of measurement/accounting, or that households took more of their waste to landfill sites themselves(!), or was it (at least partly) caused by the change in season?

It is good that Stirling council have begun to publish this data as Open Data into the public domain. It will open future, data-backed possibilities as it grows in volume and (hopefully) increases in fidelity. So, Stirling council, please keep on publishing the data (but make it more DataZone-friendly!).
The Fair Share – the CO2e saved by this university based, reuse store

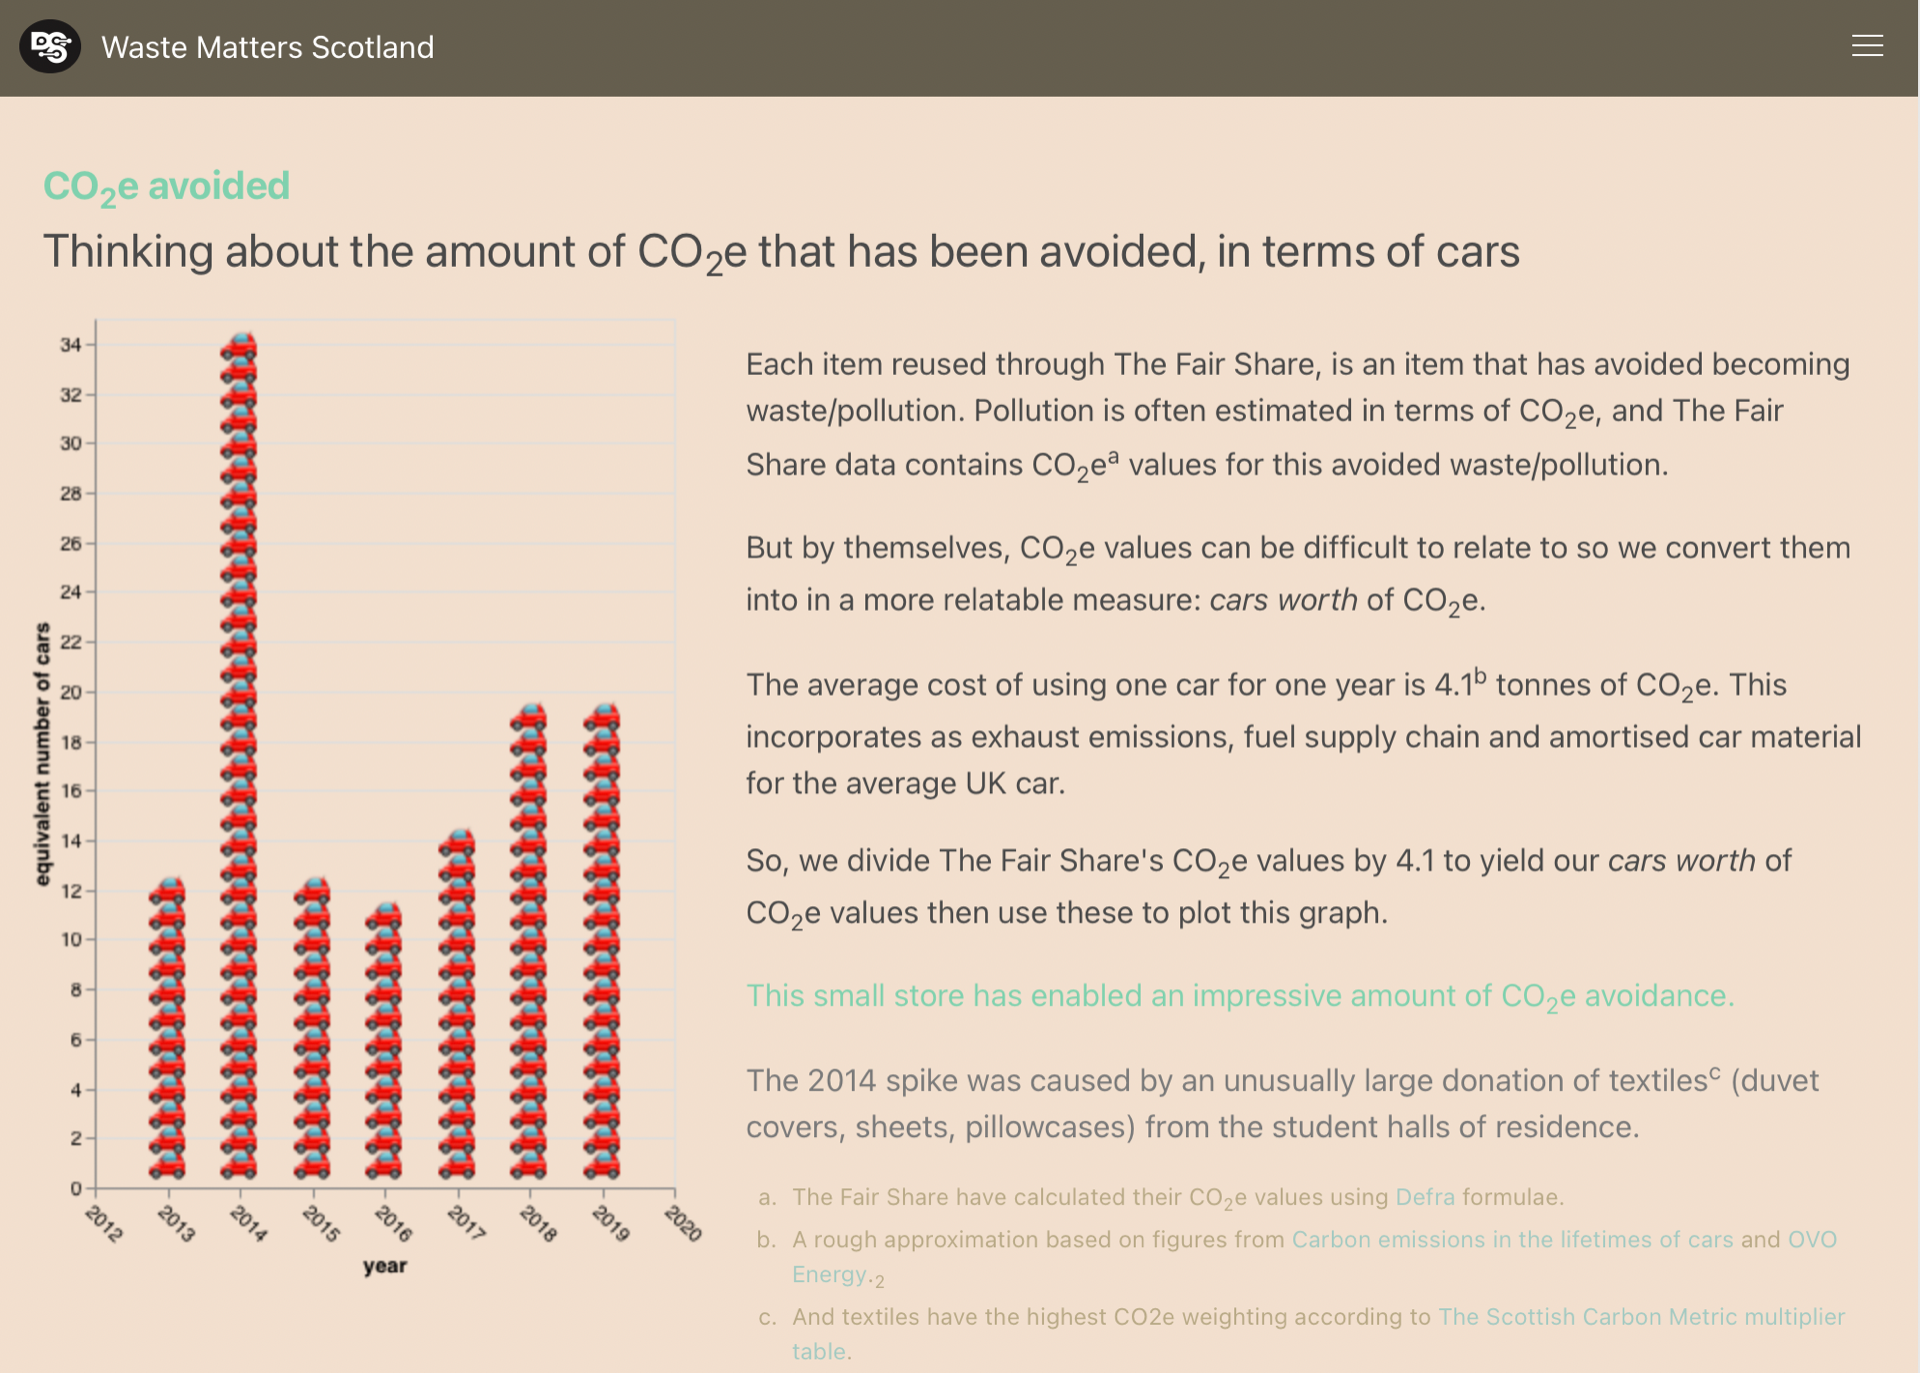
Discover how many cars worth of CO2e is avoided each year because of this university based, reuse store

The Fair Share is a university based, reuse store. It accepts donations of second-hand books, clothes, kitchenware, electricals, etc. and sells these to students. It is run by the Student Union at the University of Stirling. It meets the Revolve quality standard for second-hand stores.

The Fair Share is in the process of publishing its data as open data. Click on the image below to see a web page that is based on an draft of that work.

The Fair Share

Stirling’s bin collection data – revisited

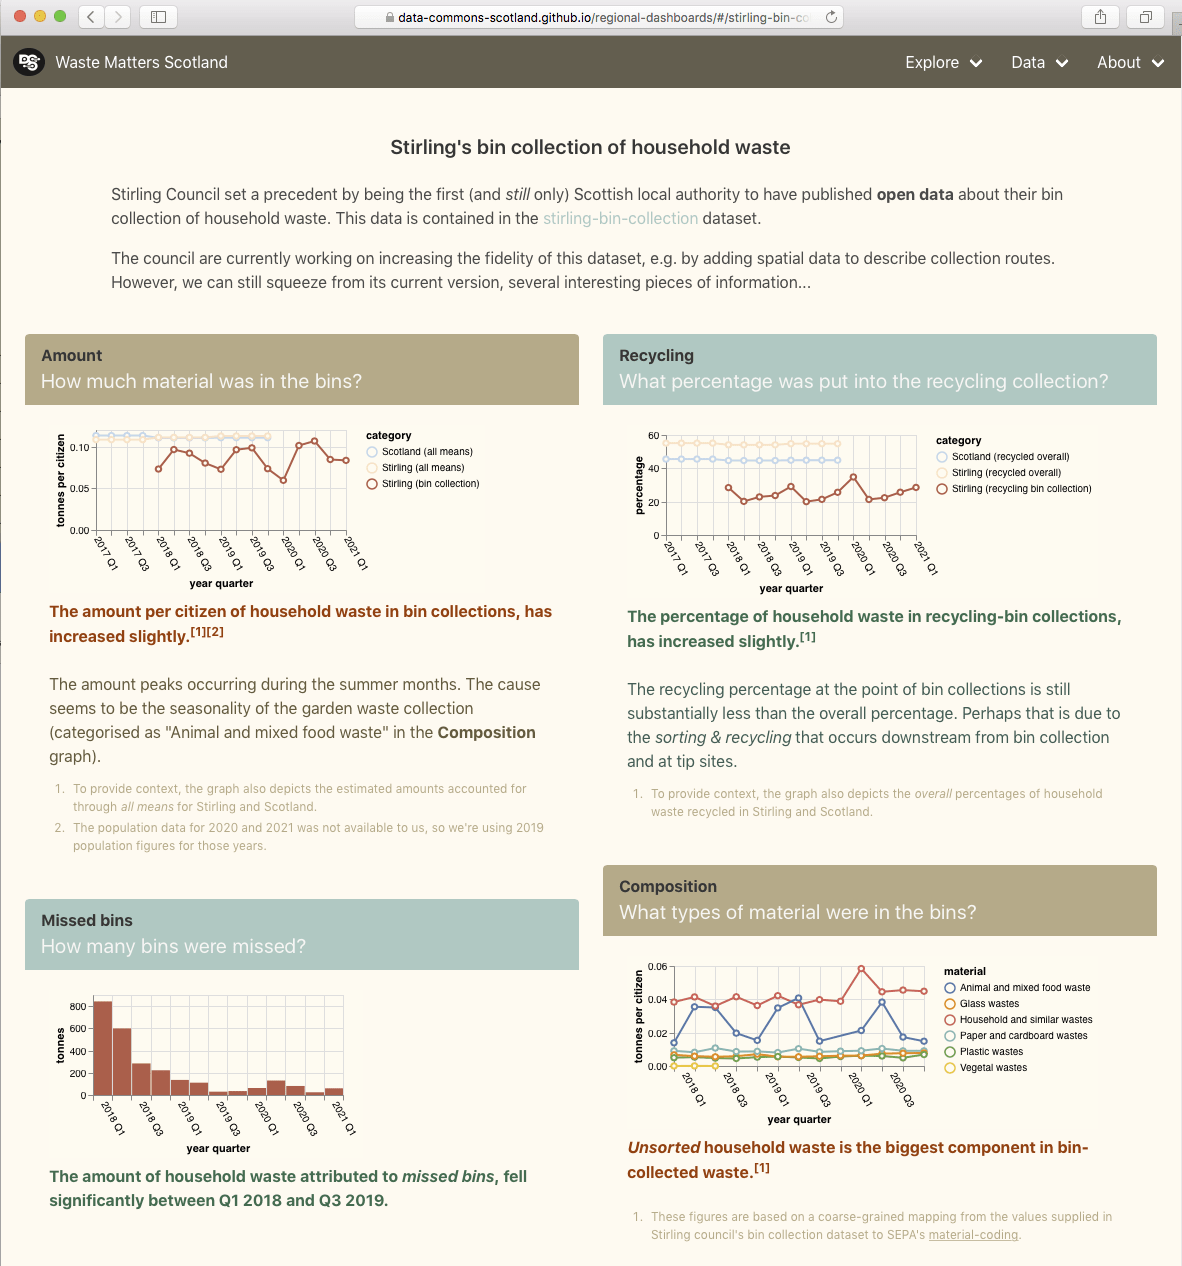
Stirling Council set a precedent by being the first (and still only) Scottish local authority to have published open data about their bin collection of household waste.

The council are currently working on increasing the fidelity of this dataset, e.g. by adding spatial data to describe collection routes. However, we can still squeeze from its current version, several interesting pieces of information. For details, visit the Stirling bin collection page on our website mockup.

Mocking-up features in a placeholder WCS web application

The narratives in Anna and Hannah’s Scenariosdocument, tantalise with mentions of the features supported by their fictional Waste Commons Scotland (WCS) web application. This week, mocked versions of some of those features have been added to the placeholder WCS web application (source code) – with the idea that their animation will make the features easier to understand and assess. 

Stirling Council’s waste-management dataset as linked open data 

Kudos to Stirling Council for being the only Scottish local authority to have published household waste collection data as open data. This data is contained in their waste-management dataset. It consists of: 

  • Core dataper year CSV files 
  • Metadata that includes a basic schema for the CSV files, maintenance information and a descriptive narrative. 

For that, Stirling Council have attained 3 stars on this openness measure.  

To reach 5 stars, that data would have to be turned into linked open data, i.e. gain the following: 

  • URIs denoting things. E.g. have a URI for each waste type, each collection route and each measurement. 
  • Links to other data to provide context. E.g. reference commonly accepted identifiers/URIs for dates, waste types and route geographies. 

This week I investigated aspects of what would be involved in gaining those extra two stars

This executable notebook steps through the nitty-gritty of doing that. The steps include: 

  1. Mapping the data into the vocabulary for the statistical data cube structure – as defined by the W3C and used by the Scottish government’s statistic office. 
  2. Mapping the date values to the date-time related vocabulary – as defined by the UK government. 
  3. Defining placeholder vocabularies for waste type and collection routes. Future work would be to: map waste types to (possibly “rolled-up” values) in a SEPA defined vocabulary; and map collection routes to a suitable geographic vocabulary. 
  4. Converting the CSV source data into RDF data in accordance to the above mappings. This results in a set of .ttl – RDF Turtle syntax – files.  
  5. Loading the .ttl files into a triplestore database so that their linked data graph can be queried easily. 
  6. Running a few SPARQL queries against the triplestore to sanity-check the linked data graph. 
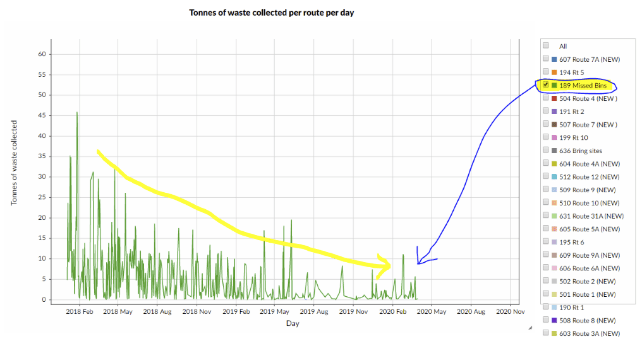
  7. Creating an example infographic (showing the downward trend in missing bins) from the linked data graph:  

 Conclusions 

  • It took a not insignificant amount of consideration to convert the 3-star non-linked data to (almost) 5-star linked data. But I expect that the effort involved will tail off if we similarly converted further datasets, because of the experience and knowledge gained along the way. 
  • Having a linked data version of the waste-management dataset promises to make its information more explicit and more compostable. But for the benefits to be fully realised, more cross-linking needs to be carried out. In particular, we need to map waste types to a common (say, SEPA controlled) vocabulary; and map collection routes to a common geographic vocabulary. 
  • We might imagine that if such a linked dataset were to be published & maintained – with other local authorities contributing data into it – then SEPA would be able to directly and constantly harvest its information so, making period report preparation unnecessary.  
  • JimT and I have discussed how the Open Data Phase2 project might push for the publication of linked open data about waste, using common vocabularies, and how our Data Commons Project could aim to fuel its user interface using that linked open data. In order words, the linked open data layer is where the two project meet.