Household-vs-business wastes in Scotland during the last decade

Screenshot of the graph of household-vs-business cases in Scotland during the last decade

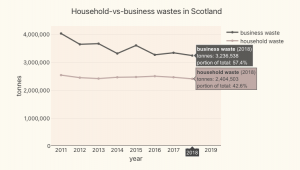
This graph provides an at-a-glance-comparison between Scotland’s households and businesses in respect of the yearly amounts waste that they have generated during the last decade.

The household:business ratio has been very approximately 2:3, but waste from businesses has been reducing noticeably over the decade.

Using a literate programming tool to generate content

Literate programming tools weave data, code, visualisations and natural language into a flowing narrative. These tools are often used to construct tutorial-style documents that are based on tractable/generatable material.

For us, this sounded like a promising approach as a way to generate content since, one of our aims is to develop (website situated) how-to guides/tutorials based on the tractable waste datasets. So we created our first tutorial-style document using this approach: A walk-through on how to extract information from the data about business waste in Scotland. Here’s a screenshot of it:Screenshot of our first document generated using a literate programming tool

It uses:
Only minimal mark-up and programming code was required (see its source file), and it has proved to be a handy means to generate a data-based tutorial.