When I watched the waste amounts change through time on this map, Fife’s amounts really stood out…
Fife was generating so much more waste from business, than the other council areas. But why?
To look at the data in more detail, I loaded it into the data grid & graph tool that we built a couple of months ago.
First, I filtered the data grid to show me: Fife’s four largest, business wastes vs their averages link.
Fife’s combustion waste stands out from the average.
Secondly, I filtered the data grid to show me: the business combustion waste quantities by sector link.
Unfortunately this data isn’t broken down by council area, but it clearly shows that most of the combustion wastes are generated by the power industry.
An internet search with this information – i.e. “Fife combustion power” – returns a page full of references to Longannet – the coal fuelled power station.
According to Wikipedia, Longannet power station was the 21st most polluting in Europe when it closed, so no wonder that its signature in the data is so obvious! It was closed on 24th March 2016, which correlates with the sharp return towards the average in 2016, of the combustion wastes graph line for Fife.
Of course this isn’t a real discovery – SEPA, Scottish Power and the people who lived around the power station will be very familiar with this data anomaly and its cause. But I think that its mildly interesting that a data lay person like me could discover this from looking at these simple data visualisations.


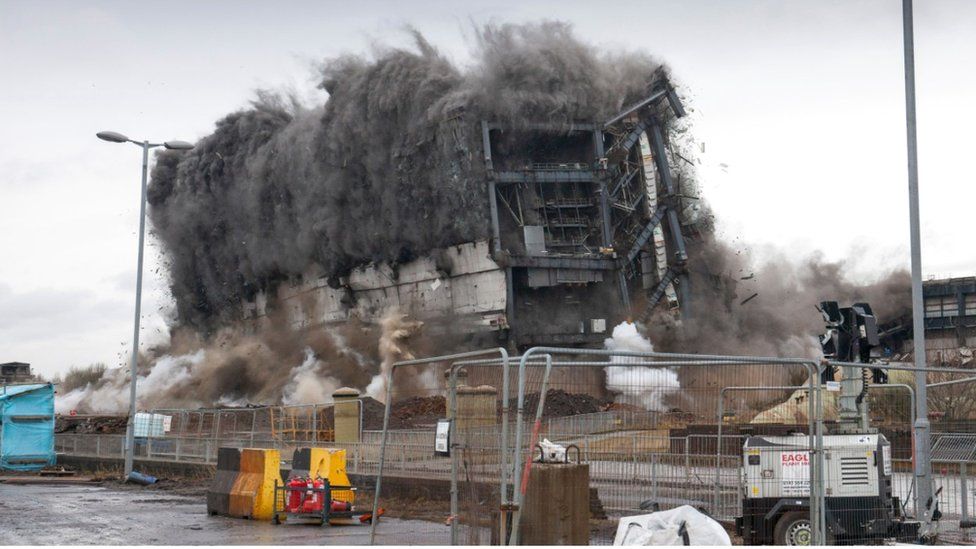
Serendipitously, the BBC have just published this article on their website: “Boiler house demolished at Longannet in Fife in controlled explosion“!
