The geography of household waste generation

Working on his human geography homework, Rory asks…

Which areas in Scotland are reducing their household waste?

This week, in a step towards supporting the above scenario, I investigated how we might generate choropleths to help us visualise the variations in the amounts of household-generated waste across geographic areas in Scotland.

The cube-to-chart executable notebook steps through the nitty-gritty of this experiment. The steps include:

    1. Running a SPARQL query against statistics.gov.scot’s very useful data cubes to find the waste tonnage generated per council citizen per year.
    2. For each council area, derive the 3 values:
      • recent – 2018’s tonnage of waste generated per council citizen.
      • average – 2011-2018’s average (mean) tonnage of waste generated per council citizen.
      • trend – 2011-2018’s trend in tonnage of waste generated per council citizen. Each trend value is calculated as the gradient of a linear approximation to the tonnage over the years. (A statistician might well suggest a more appropriate method for computing this trend value.)

      The derived data can be seen in this file.

    3. Use Vega to generate 3 choropleths which help visualise the statistical values from the above step, against the council-oriented geography of Scotland. (The geography data comes from Martin Chorely’s good curation work.)

The resulting choropleths can be seen on >> this page <<

Rory looks at the “2011-2018 trend in tonnage” choropleth, and thinks…

It’s good to see that most areas are reducing waste generation but why not all…?

Looking at the “2018 tonnage” and 2011-2018 average tonnage” choropleths, Niamh wonders…

I wonder why urban populations seem to generate less waste than rural ones?
Increasing this project’s on-line presence

This project needs more presence on-line. Thanks for prompting this Ian! (And be sure to read Ian’s posting on the state of open data.) So, this week…

  • Anna & I have made a start on revamping this, the project’s public WordPress site, which Anna created late last year. This site is accessible at https://campuspress.stir.ac.uk/datacommonsscotland. The idea is that we’ll publish on it limited-lifespan information such as relevant happenings & blog postings and take feedback comments.
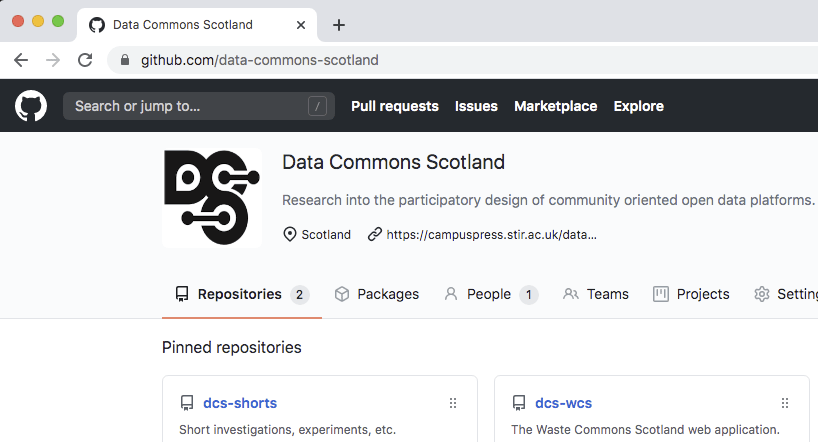
  • Also, I’ve create a public GitHub site at https://github.com/data-commons-scotland for some of the project’s longer-lifespan outputs such as concepts/models, standards, research output and open source code. GitHub will continue to preserve these (hopefully useful) outputs beyond the lifespan of this project. I’ve made a start by adding some investigation reports (dcs-shorts) and example web application source code (dcs-wcs).

Mocking-up features in a placeholder WCS web application

The narratives in Anna and Hannah’s Scenariosdocument, tantalise with mentions of the features supported by their fictional Waste Commons Scotland (WCS) web application. This week, mocked versions of some of those features have been added to the placeholder WCS web application (source code) – with the idea that their animation will make the features easier to understand and assess.