Data Commons Scotland at the SODU 2021 conference

Over the weekend (2-3 Sept 2021), I represented our DCS project at SODU 2021 – Scotland’s annual conference on Open Data.
Organised and run by the Code the City team, this event always provides a great opportunity to catch up with others in Scotland’s friendly Open Data community, and hear about their news.
This year, for me, its highlights included:
  • A “corridor chat” that began ad-hoc, about the preservation of railway history as represented by its data records (mostly paper based).That lead us to discuss Git persistence, the zeitgeist for shared ledger databases with explicit temporal support, and what all of that might mean for recording Open Data!
  • Then, a session on the perhaps more immediate concern of: how to nudge the government into making open, more of the data which it holds. Proposed was the neat idea of aggregating, curating and making searchable all of the responses arising from FOI-requests to local and national government. This would help highlight data that that the government should be making open by default.
  • And it was heartening to see representatives from the Scottish government’s Open Data team attending the conference and running an engaging session that brought together government and community perspectives. The government’s recent initiative to make public sector data easy to find” was one of the topics discussed.
  • The conference even gained an international dimension when two attendees joined us from Sweden to help run a live editing session on Wikidata, contributing to the project to add better data about Scottish government agencies into Wikidata.
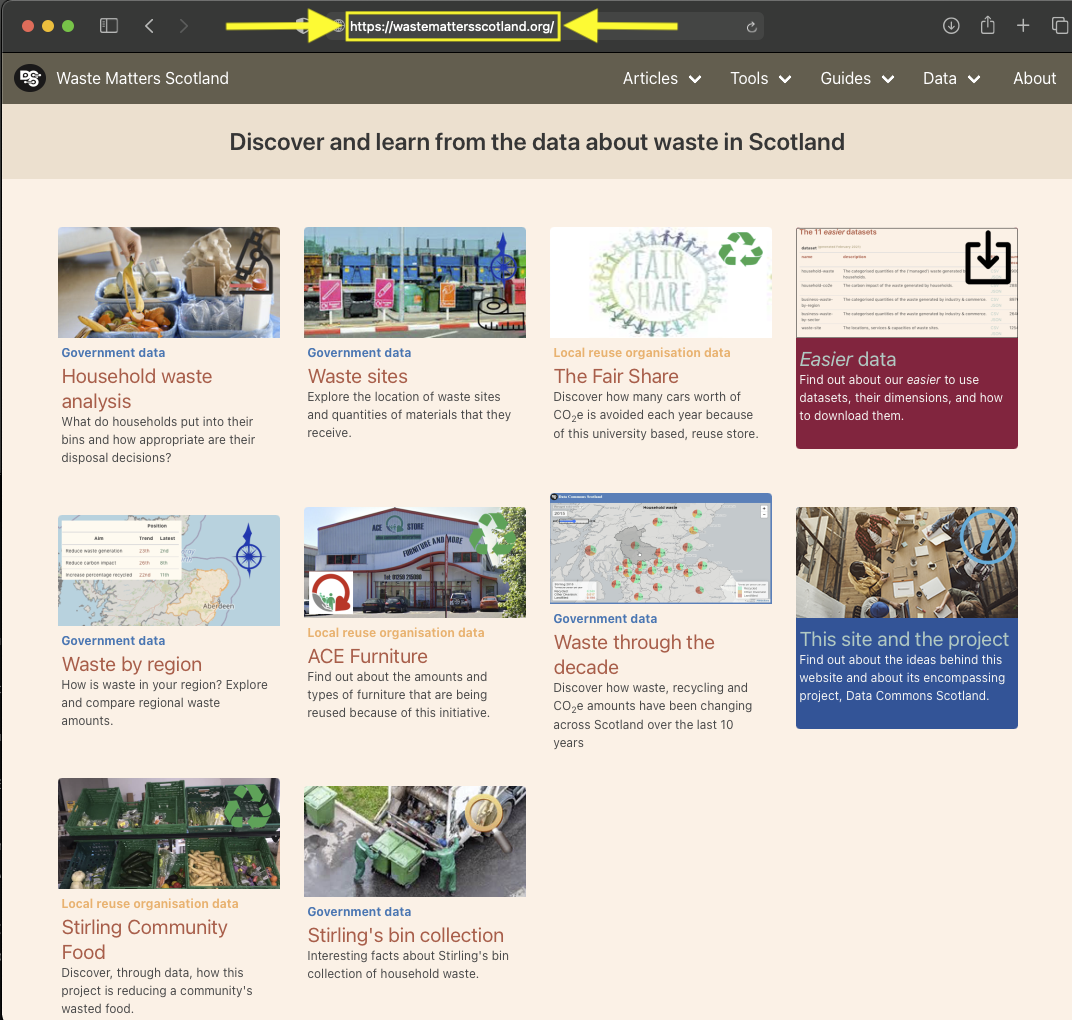
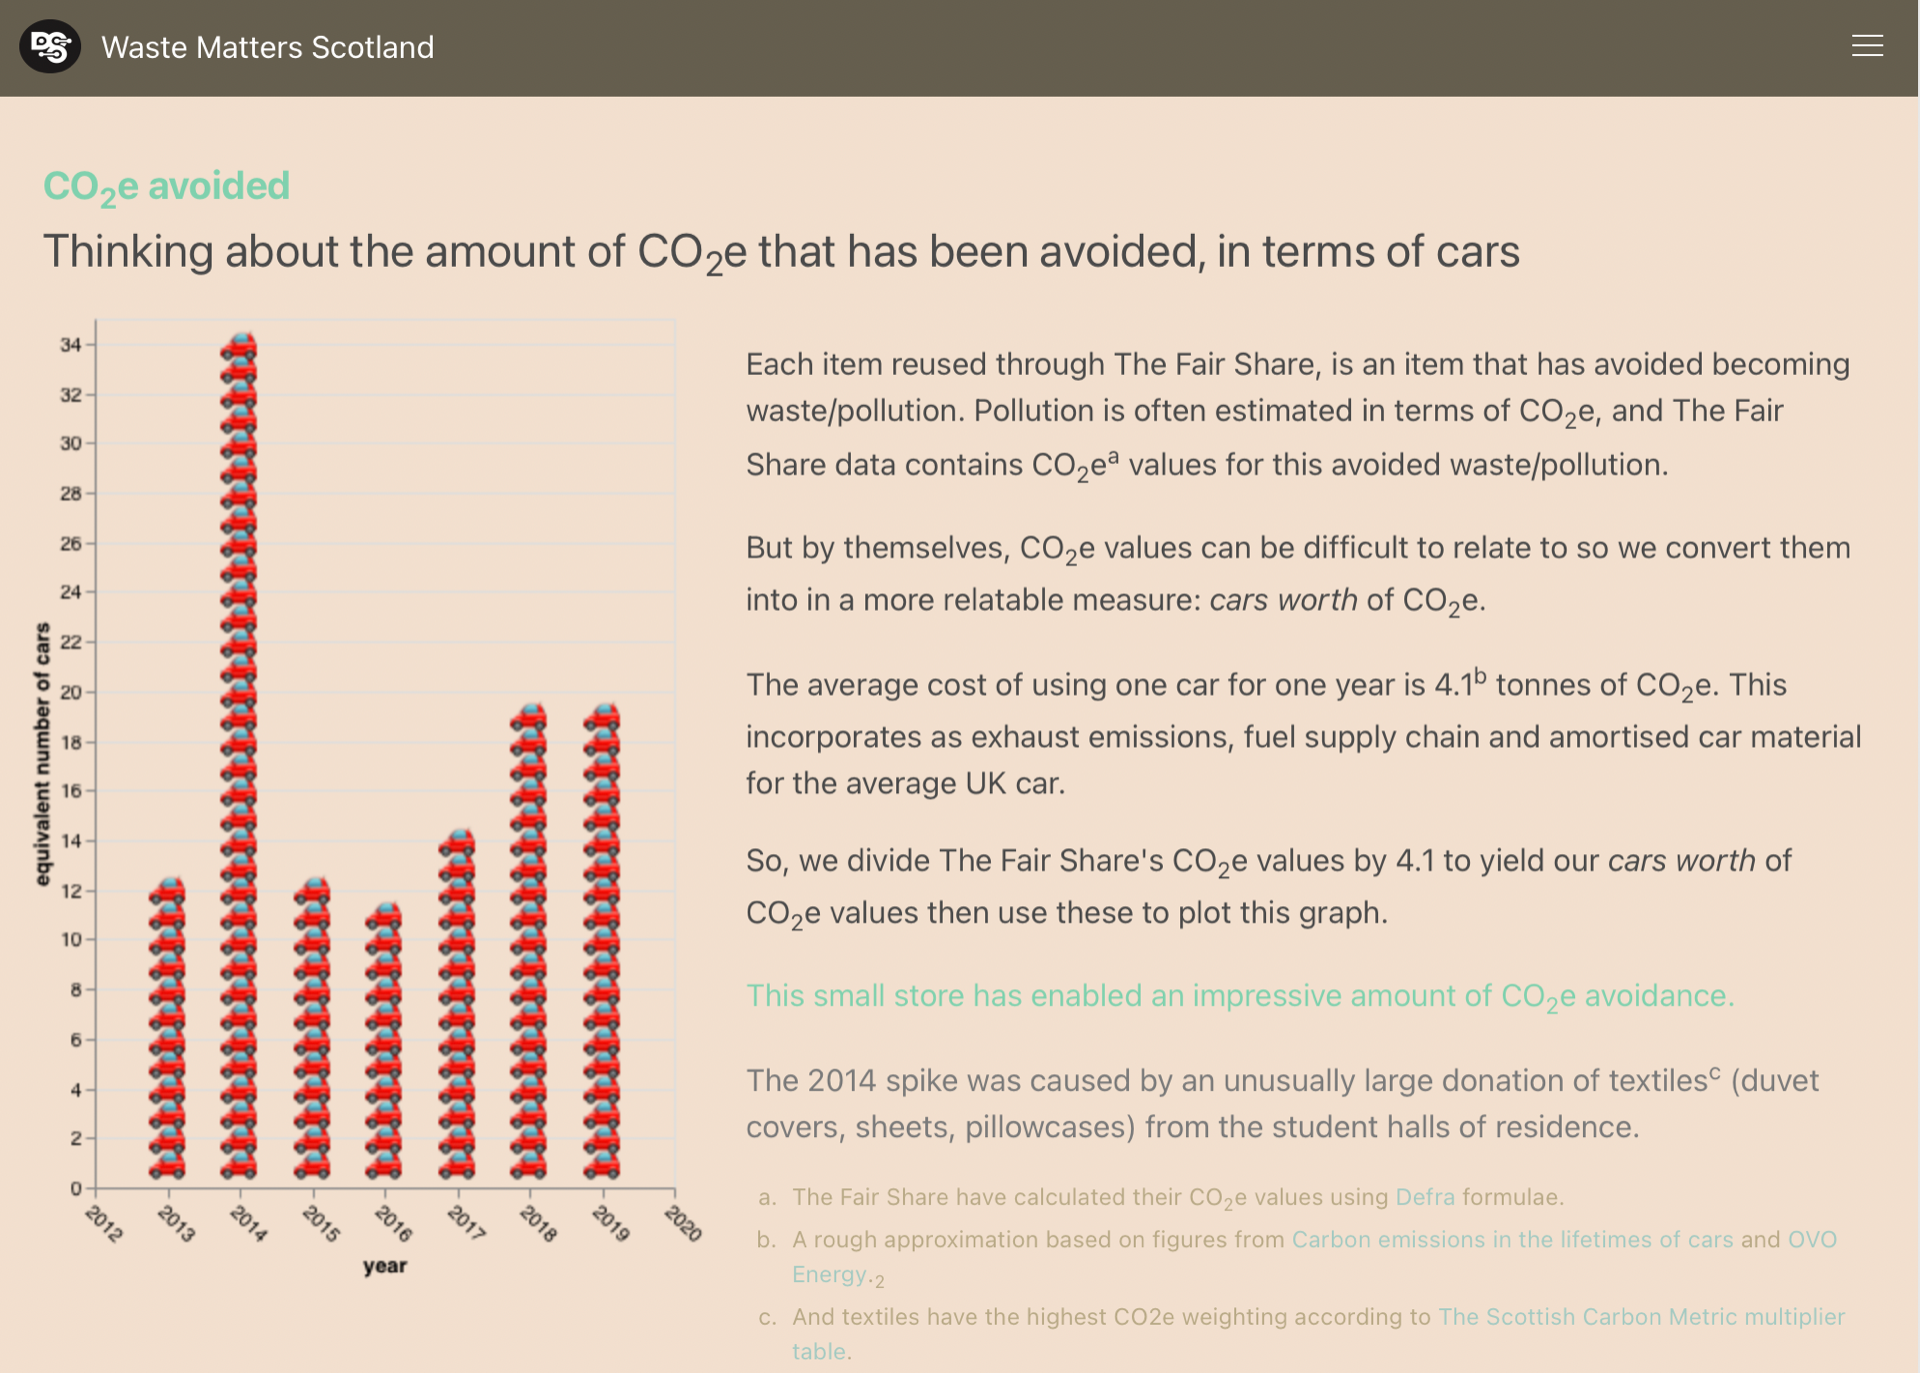
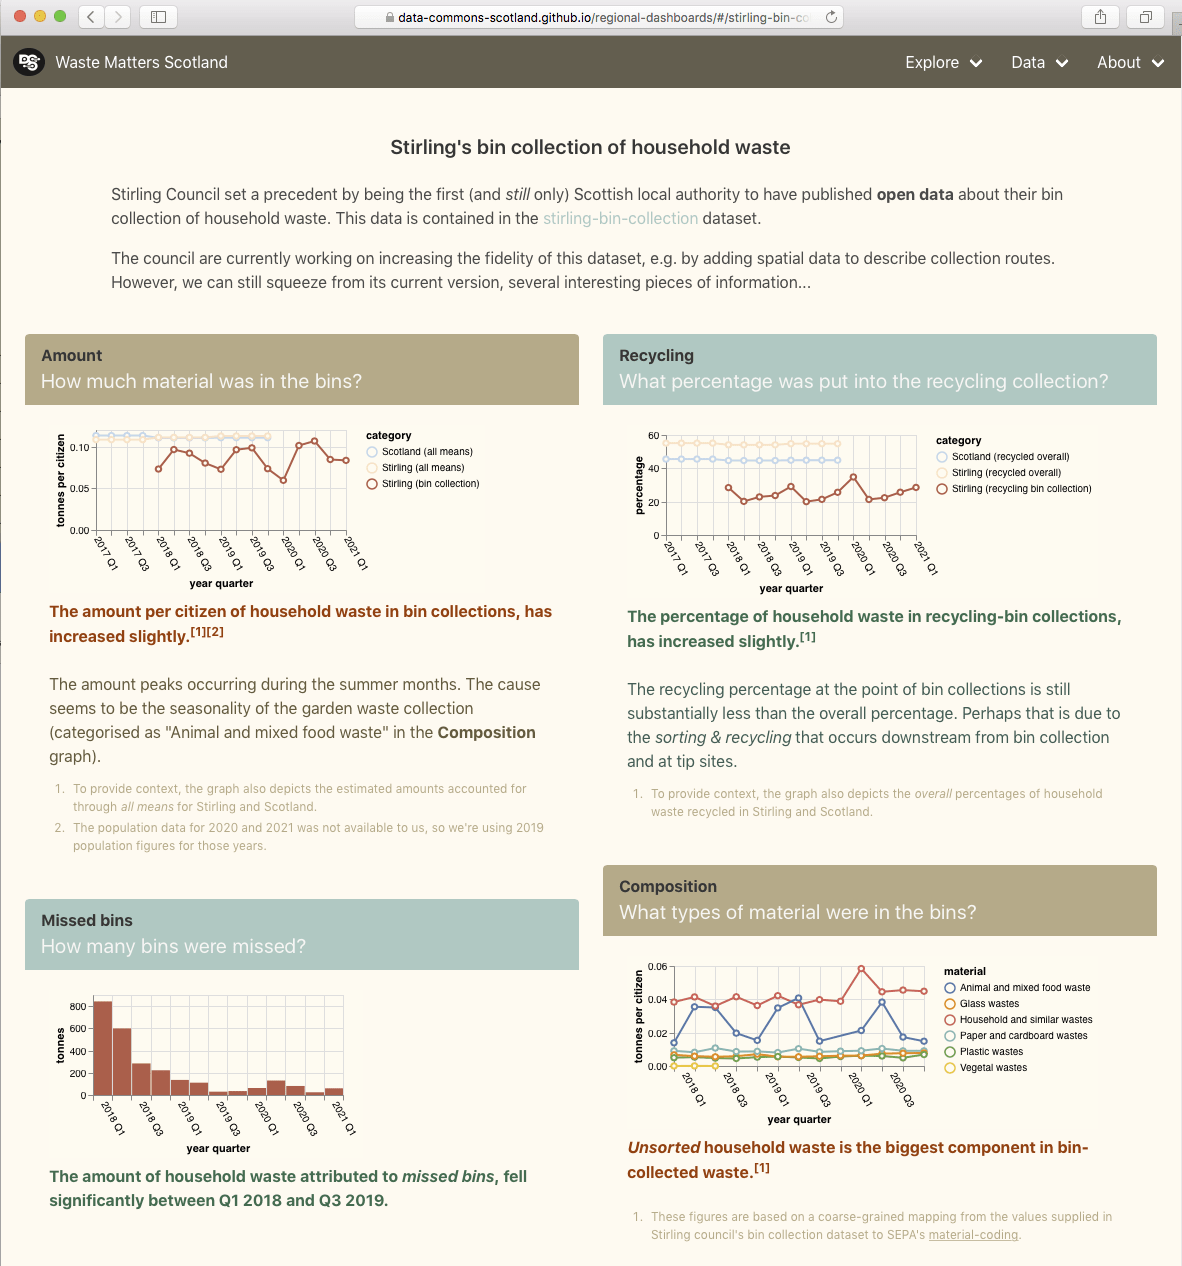
  • Our own project received some valuable feedback after I demo-ed our latest prototype website.This wasn’t just all affirmative!… I got some useful insights into what what people found difficult. For example, I like the site’s tools and visualisations but, more needs to be done to help me navigate my path-of-interest through the prototype website“. This nicely ties in with one of our project’s (as yet unrealised) goals: to weave interest-based navigation maps through our data site.
I enjoyed the friendly SODU sessions over the weekend – it was inspiring to hear what others are contributing towards making data more open and accessible.
This year’s SODU was online because of Covid-19. Hopefully next year it will return to its more physical manifestation in Aberdeen city!

“What are my neighbours putting into their bins?!”

What do households put into their bins and and how appropriate are their disposal decisions?

To help provide an answer to that question, Zero Waste Scotland (ZWS) occasionally asks each of the 32 Scottish councils to sample their bin collections and to analyse their content. This compositional analysis uncovers the types and weights of the disposed of materials, and assesses the appropriateness of the disposal decisions (i.e. was it put into the right bin?).

Laudably, ZWS is considering publishing this data as open data. Click on the image below to see a web page that is based on an anonymised subset of this data.

household waste analysis

The Fair Share – the CO2e saved by this university based, reuse store

Discover how many cars worth of CO2e is avoided each year because of this university based, reuse store

The Fair Share is a university based, reuse store. It accepts donations of second-hand books, clothes, kitchenware, electricals, etc. and sells these to students. It is run by the Student Union at the University of Stirling. It meets the Revolve quality standard for second-hand stores.

The Fair Share is in the process of publishing its data as open data. Click on the image below to see a web page that is based on an draft of that work.

The Fair Share

Our new sister project, Waste Stories

We have recently launched a new sister project that complements the Data Commons Scotland’s data-based orientation to waste and resources in Scotland with an approach based on generating stories and short fiction about the materials that enter the waste stream in Scotland.

Waste Stories is a project that aims to transform the relationships that we have with waste by exploiting the affective power of story-telling.  It involves Data Commons Scotland team members Anna Wilson, Hannah Hamilton and Greg Singh. You can find out more about it here:

https://campuspress.stir.ac.uk/wastestories/

We’ll be using some of the images and stories generated through this project to enhance the Data Commons Scotland open data platform in future.

The Data Lab MSc data challenge event 2021

With Glasgow City hosting the UN Climate Change conference (COP26) later this year, it was appropriate that this year’s The Data Lab data analysis hackathon (held last week) had the theme “pollution reduction”.

Three organisations provided challenge projects for the hackathon teams: we provided a “waste management” project based on our easier-to-use datasets; Code the City provided an “air quality” project; and Scottish Power an “electric vehicle charging” project.

The hackathon was lead by a young Scottish tech start-up company called Filament. They have an interesting product that is basically a sharable, cloud-hosted Jupyter Notebook.

Each day a new cohort of teams would tackle the project challenges. We helped by answering their questions about our datasets, and by suggesting ideas for investigation.
At the end of each day the teams presented their findings.

It was informative to see how the teams (each with a mix of skills that included programming, data analysis and business acumen) organised themselves for group working, handled the data, and applied learned analysis techniques.

The teams had a relatively short amount of time to work on their projects so having easy to use datasets was a deciding factor in how much they could achieve. Therefore one take-away is clear, and helps substantiate an aim of our DCS project… open data needs to be easy to use, not just be accessible. Making data easier to use for non-experts, opens it to a much wider audience and to much more creativity.

The prototype’s architecture – revised

“Trialling Wikibase for our data layer” described how we evaluated the use of Wikibase as a key implementation component in our bi-layer architecture. The conclusion was that Wikibase, although a brilliant product, does not fit our immediate purpose.

In our revised architecture…​

Wikibase is replaced with (dcs-easier-open-data) a simple set of data files (CSV and JSON) hosted in a public repository (GitHub). These data files are generated by the Waste Data Tool (dcs-wdt). Together, dcs-easier-open-data and dcs-wdt implement the architecture’s data layer.

In the architecture’s revised presentation layer, the webapp reads (CSV/JSON formatted) data from the dcs-easier-open-data respository, instead of reading (via SPARQL) data from the Wikibase.

The prototype’s bi-layered architecture - revised

Stirling’s bin collection data – revisited

Stirling Council set a precedent by being the first (and still only) Scottish local authority to have published open data about their bin collection of household waste.

The council are currently working on increasing the fidelity of this dataset, e.g. by adding spatial data to describe collection routes. However, we can still squeeze from its current version, several interesting pieces of information. For details, visit the Stirling bin collection page on our website mockup.

“How is waste in my area?” – a regional dashboard

Introduction

Our aim in this piece of work is:

to surface facts of interest (maximums, minimums, trends, etc.) about waste in an area, to non-experts.

Towards that aim, we have built a prototype regional dashboard which is directly powered by our ‘easier datasets’ about waste.

The prototype is a webapp and it can be accessed here.

our prototype regional dashboard

Curiosities

Even this early prototype manages to surface some curiosities [1] …​

Inverclyde

Inverclyde is doing well.

Inverclyde’s household waste positions Inverclyde’s household waste generation Inverclyde’s household waste CO2e

In the latest data (2019), it generates the fewest tonnes of household waste (per citizen) of any of the council areas. And its same 1st position for CO2e indicates the close relation between the amount of waste generated and its carbon impact.

…​But why is Inverclyde doing so well?

Highland

Highland isn’t doing so well.

Highland’s household waste positions Highland’s household waste generation Highland’s household waste % recycled

In the latest data (2019), it generates the most (except for Argyll & Bute) tonnes of household waste (per citizen) of any of the council areas. And it has the worst trend for percentage recycled.

…​Why is Highland’s percentage recycled been getting worse since 2014?

Fife

Fife has the best trend for household waste generation. That said, it still has been generating an above the average amount of waste per citizen.

Fife’s household waste positions Fife’s household waste generation

The graphs for Fife business waste show that there was an acute reduction in combustion wastes in 2016.

Fife’s business waste

We investigated this anomaly before and discovered that it was caused by the closure of Fife’s coal fired power station (Longannet) on 24th March 2016.

Angus

In the latest two years of data (2018 & 2019), Angus has noticibly reduced the amount of household waste that it landfills.

Angus' household waste management

During the same period, Angus has increased the amount household waste that it processes as ‘other diversion’.

…​What underlies that difference in Angus’ waste processing?

Technologies

This prototype is built as a ‘static’ website with all content-dynamics occurring in the browser. This makes it simple and cheap to host, but results in heavier, more complex web pages.

  • The clickable map is implemented on Leaflet – with Open Street Map map tiles.
  • The charts are constructed using Vega-lite.
  • The content-dynamics are coded in ClojureScript – with Hiccup for HTML, and Reagent for events.
  • The website is hosted on GitHub.

Ideas for evolving this prototype

  1. Provide more qualitative information. This version is quite quantitative because, well, that is nature of the datasets that currently underlay it. So there’s a danger of straying into the “managment by KPI” approach when we should be supporting the “management by understanding” approach.
  2. Include more localised information, e.g. about an area’s re-use shops, or bin collection statistics.
  3. Support deeper dives, e.g. so that users can click on a CO2e trend to navigate to a choropleth map for CO2e.
  4. Allow users to download any of the displayed charts as (CSV) data or as (PNG) images.
  5. Enhance the support of comparisons by allowing users to multi-select regions and overlay their charts.
  6. Allow users to choose from a menu, what chart/data tiles to place on the page.
  7. Provide a what-if? tool. “What if every region reduced by 10% their landfilling of waste material xyz?” – where the tool has a good enough waste model to enable it to compute what-if? outcomes.

1. One of the original sources of data has been off-line due to a cyberattack so, at the time of writing, it has not been possible to double-check all figures from our prototype against original sources.

A mock-up website for functionality & navigation

Introduction

A prototype website will be one of the outcomes of this research project. The website should help non-experts discover, learn about and understand the open data about waste in Scotland.

To date, we have build a couple of mock-ups [1]:

  1. functionality & navigation mock-up for exploring ideas about functionality and navigation for our eventual website.
  2. look’n’feel mock-up for exploring looks/visual aesthetics.

This document concentrates on the functionality & navigation mock-up…​

The splash page of the functionality & navigation mock-up

Functionality

This mock-up ties together a lot of the elements we’ve been working on:

Data Direct access to download the underlying datasets.
A simple, consistent set of CSV and JSON files.
Maps Interactive, on-map depictions of the information from the datasets.
Data grids with graphs A tool for slicing’n’dicing the datasets and visualising the result as a graph.
To make this easier, this tool will provide useful slicing’n’dicing presets: starting points from which users can explore.
SPARQL A query interface to a semantic web representation of the datasets.
This is unlikely to be of use to our target audience, so we’ll probably remove it from the UI but may use its semantic graph internally.
Articles Themed articles and tutorials that are based on evidence from the datasets.
Uses Asciidoc mark-up to make the articles easy to format.
The articles may incorporate data visualisations that are backed by our datasets.

Navigation

The mock-up provides 3 routes to information:

Themes The clickable blocks on the splash page allows users to explore a waste theme by taking the user to a specific set of of articles and tutorials.
Navbar The menu bar at the top of each page, provides an orthogonal, more ‘functional’ classification of the website’s contents.
Search At present, this is a very basic text & tag search. In the future, a predicative/auto-suggestion search based on a semantic graph of the contents, will be provided.

Users navigation histories may help power a further-reading recommender subsystem.

Architecture

Building this mock-up has required some architectural decisions that may help inform the design of our eventual website.

Static website The mock-up has been implemented as a so-called ‘static website’. This means that page content is not dynamically generated by (or saved to) the server-side. The server-side simply serves ‘static content files’.

Pros Implementation-wise, it is an order of magnitude simpler and more scalable than a ‘dynamic’ website.
There are several good, free, open source ‘static website generators/frameworks’.
Static websites can be served for free on hosting platforms such as GitHub (as used for this mock-up).
Cons It can’t support a whole class of functionality, including user uploads, and on-line content editing.
Computation is forced towards the client-side (i.e. into users’ web browsers) which sometimes can have a negative impact on the speed of the UI.
Off-line updates The content of the website can be updated – just not updated on-line. The website maintainers can add new/edit existing datasets, articles, etc. via off-line means.
For off-line updates to this mock-up we use: (i) WDT – a rough’n’ready software script that helps us to curate the datasets that underlay this mock-up; (ii) Cryogen – a static website generator; (iii) Git – to upload updates to our GitHub hosting service.
Client-side computation Page content is dynamically manipulated (e.g. datasets are slice’n’diced) on the client-side (in users’ web browsers) using JavaScript. This enables, for example, the mock-up’s web pages to take the static content that is served by the server-side, and manipulate it so that it can support interactive data visualisations.
Progress in client-side technology even makes it possible to implement a semantic graph supporting triple store in a web browser!

Conclusion

This mock-up website…​

  • provides concrete test-bed for evolving the functionality & navigation aspects of our eventual website, and
  • forces us to think about architectural trade-offs.

1. We use the term “mock-up” to mean an incomplete representation/model – useful for demonstration, design evaluation and acquiring user feedback.